Verisk Property Estimating Solutions has released its quarterly property report for April through June 2024, providing an overview of market trends, claims data, and economic factors affecting the property insurance industry in the US and Canada.
The report compiles extensive data from various third-party sources, focusing on labor, materials, reconstruction costs, and claims activity. It also reviews Verisk's internal claims data to identify significant trends compared to prior years, with a particular emphasis on the Texas wind and hail claims environment.
In Q2 2024, overall claims assignment volume remained relatively stable compared to the same period in 2023. Non-catastrophe (non-cat) assignments increased by 1.3%, while catastrophe (cat) assignments decreased by 3.6%.
Although claim volume has leveled off compared to 2023, it remains significantly higher than 2020-2022 levels, driven by an increase in cat claims. This underscores the growing importance of disaster response preparedness for insurers, contractors, and independent adjusters.
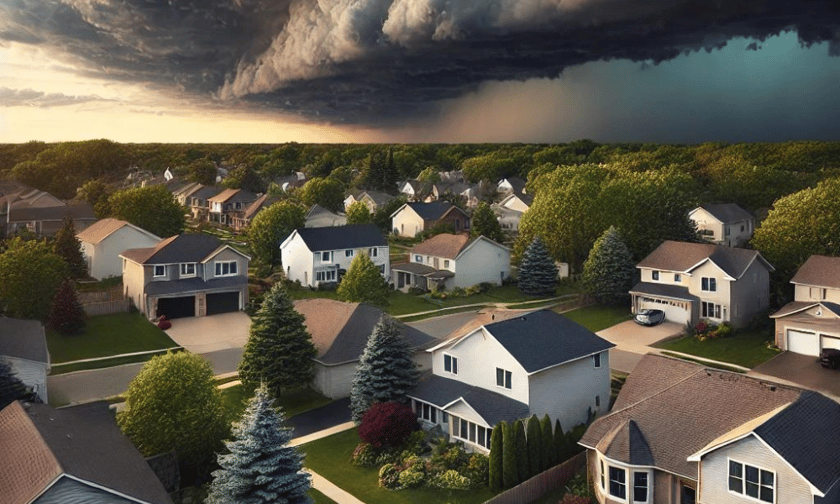
Hail and wind losses made up 57% of all assignments in Q2, a typical trend during the spring and summer months. Verisk expects this trend to continue through Q3, coinciding with the peak of hurricane season. Texas had the highest number of assignments during the quarter, largely driven by wind and hail claims. This pattern has been consistent with previous years.
The US saw several major cat events during Q2 2024, with heavily populated states like Texas showing high volumes of cat assignments. Hail-prone states such as Colorado, Missouri, and Illinois also reported significant cat activity due to peak hail season, which typically spans from March to June.
In contrast, California, which usually experiences a high number of non-hail cat events, saw a 67% decline in cat assignments compared to Q2 2023, primarily due to a reduction in severe windstorms. Meanwhile, Oregon and Nebraska saw the largest increases in assignment volumes, with both states experiencing surges exceeding 200% compared to the same period last year.
Severe weather events in Texas, particularly in the Dallas-Fort Worth and Sherman areas, had a notable impact on the roofing industry. In May 2024, both areas experienced significant weather-related damage. Fort Worth faced widespread power outages due to destructive winds, while Sherman saw severe hailstorms that caused considerable property damage.
As a result, roofing costs in these regions rose significantly, with Dallas/Fort Worth reporting a 7.5% increase in the cost of roof replacements and Sherman seeing a 9.7% increase. These localized spikes were largely attributed to rising labor costs following the storms.
Across Texas, roofing costs increased by 1.0%, while the US as a whole saw a modest 0.2% rise. The principle of supply and demand played a key role in driving up costs in storm-affected areas, while broader national increases remained minimal.
Labor and material costs showed varied trends across the US and Canada during Q2 2024. US labor costs increased by 0.88%, while Canada saw a smaller increase of 0.65%. Concrete and asphalt were the main drivers of these increases, with US costs rising by 4.56% and Canadian costs by 2.38%.
Concrete masons saw the highest labor cost increases in both countries, with US costs rising by 9.36% and Canadian costs by 5.79%. When excluding concrete masons, labor cost increases were more modest, with the US seeing a 1.36% increase and Canada a 1.20% rise.
Material costs also fluctuated across the quarter. In the US, carpet material led quarterly increases at 1.52%, while in Canada, roofing materials saw the highest increase at 3.60%, driven by rising composition shingle costs.
Fuel costs saw a 1.08% decrease in the US and a 0.36% decrease in Canada during Q2 2024, but recent trends indicate a potential reversal, with prices rising by 1.46% in the US and 2.14% in Canada in the most recent period.
Regional disparities persisted, with the US Gulf Coast averaging the lowest fuel costs at $3.07 per gallon, while the West Coast faced the highest at $4.24 per gallon. In Canada, British Columbia reported the highest fuel costs at 201.7 cents per liter, while Manitoba had the lowest at 141.4 cents per liter.
Verisk’s Q2 2024 report highlights the continued impact of severe weather events on the property insurance market, particularly in Texas. Hail and wind claims dominated assignments, and regional variations in labor and material costs reflect the ongoing challenges facing the industry.
As insurers and contractors prepare for the second half of the year, Verisk's data points to the need for careful resource allocation and disaster response planning amid rising costs and changing weather patterns.
What are your thoughts on this story? Please feel free to share your comments below.