The California Surplus Lines Market Index highlights the sector’s resilience and adaptability, even amid economic and environmental challenges. These trends serve as both a gauge of market health and a strategic tool for shaping policy offerings, pricing and risk management.
This report examines key aspects of California’s surplus lines market, including:
The analysis provides insurers and brokers with critical insights into overall market trends, sector-specific shifts and the strategies top players use to drive revenue growth.
California’s surplus lines insurance market has undergone significant shifts in recent years, driven largely by the increasing frequency of natural disasters—particularly wildfires—and the resulting pullback by traditional insurers.
The rise in climate-related catastrophes has forced many admitted insurers to reassess their exposure in high-risk areas. Some have responded with steep rate hikes, tighter underwriting standards, or full market withdrawals.
As a result, homeowners—especially in wildfire-prone regions—have struggled to find coverage through traditional carriers. Surplus lines insurers have stepped in to fill the gap, leveraging their greater flexibility in underwriting and pricing.
In 2023, surplus lines carriers held just 0.5% of California’s homeowners insurance market, while admitted insurers covered 95.8% and the state-run FAIR Plan accounted for 3.7%. By 2024, surplus lines had expanded to 3.8%, matching the FAIR Plan’s share. This shift signals the growing role of surplus lines as a mainstream alternative, particularly in major metropolitan areas.
Financial data further underscores this trend. The California Surplus Lines Market Index, which tracks the average premium per transaction, reached $19,649.86 in December 2024—a 21.52% increase from a year earlier. The rise reflects a growing reliance on surplus lines to meet coverage needs unmet by the admitted market.
The adoption of surplus lines policies has varied widely across California. In Bakersfield, surplus lines homeowners' policies surged more than 2,500%, while San Jose also recorded a sharp increase. These regional disparities underscore how local market dynamics and environmental risks shape insurance availability.
The growing reliance on surplus lines is expected to continue into 2025, highlighting the sector’s critical role in maintaining insurance access. This shift reflects both the admitted market’s challenges in addressing evolving risks and the surplus lines market’s adaptability in filling coverage gaps.
According to the Surplus Line Association of California, the sector is projected to sustain its momentum, reaching approximately $22 billion in total premium and 1.35 million transactions in 2025.
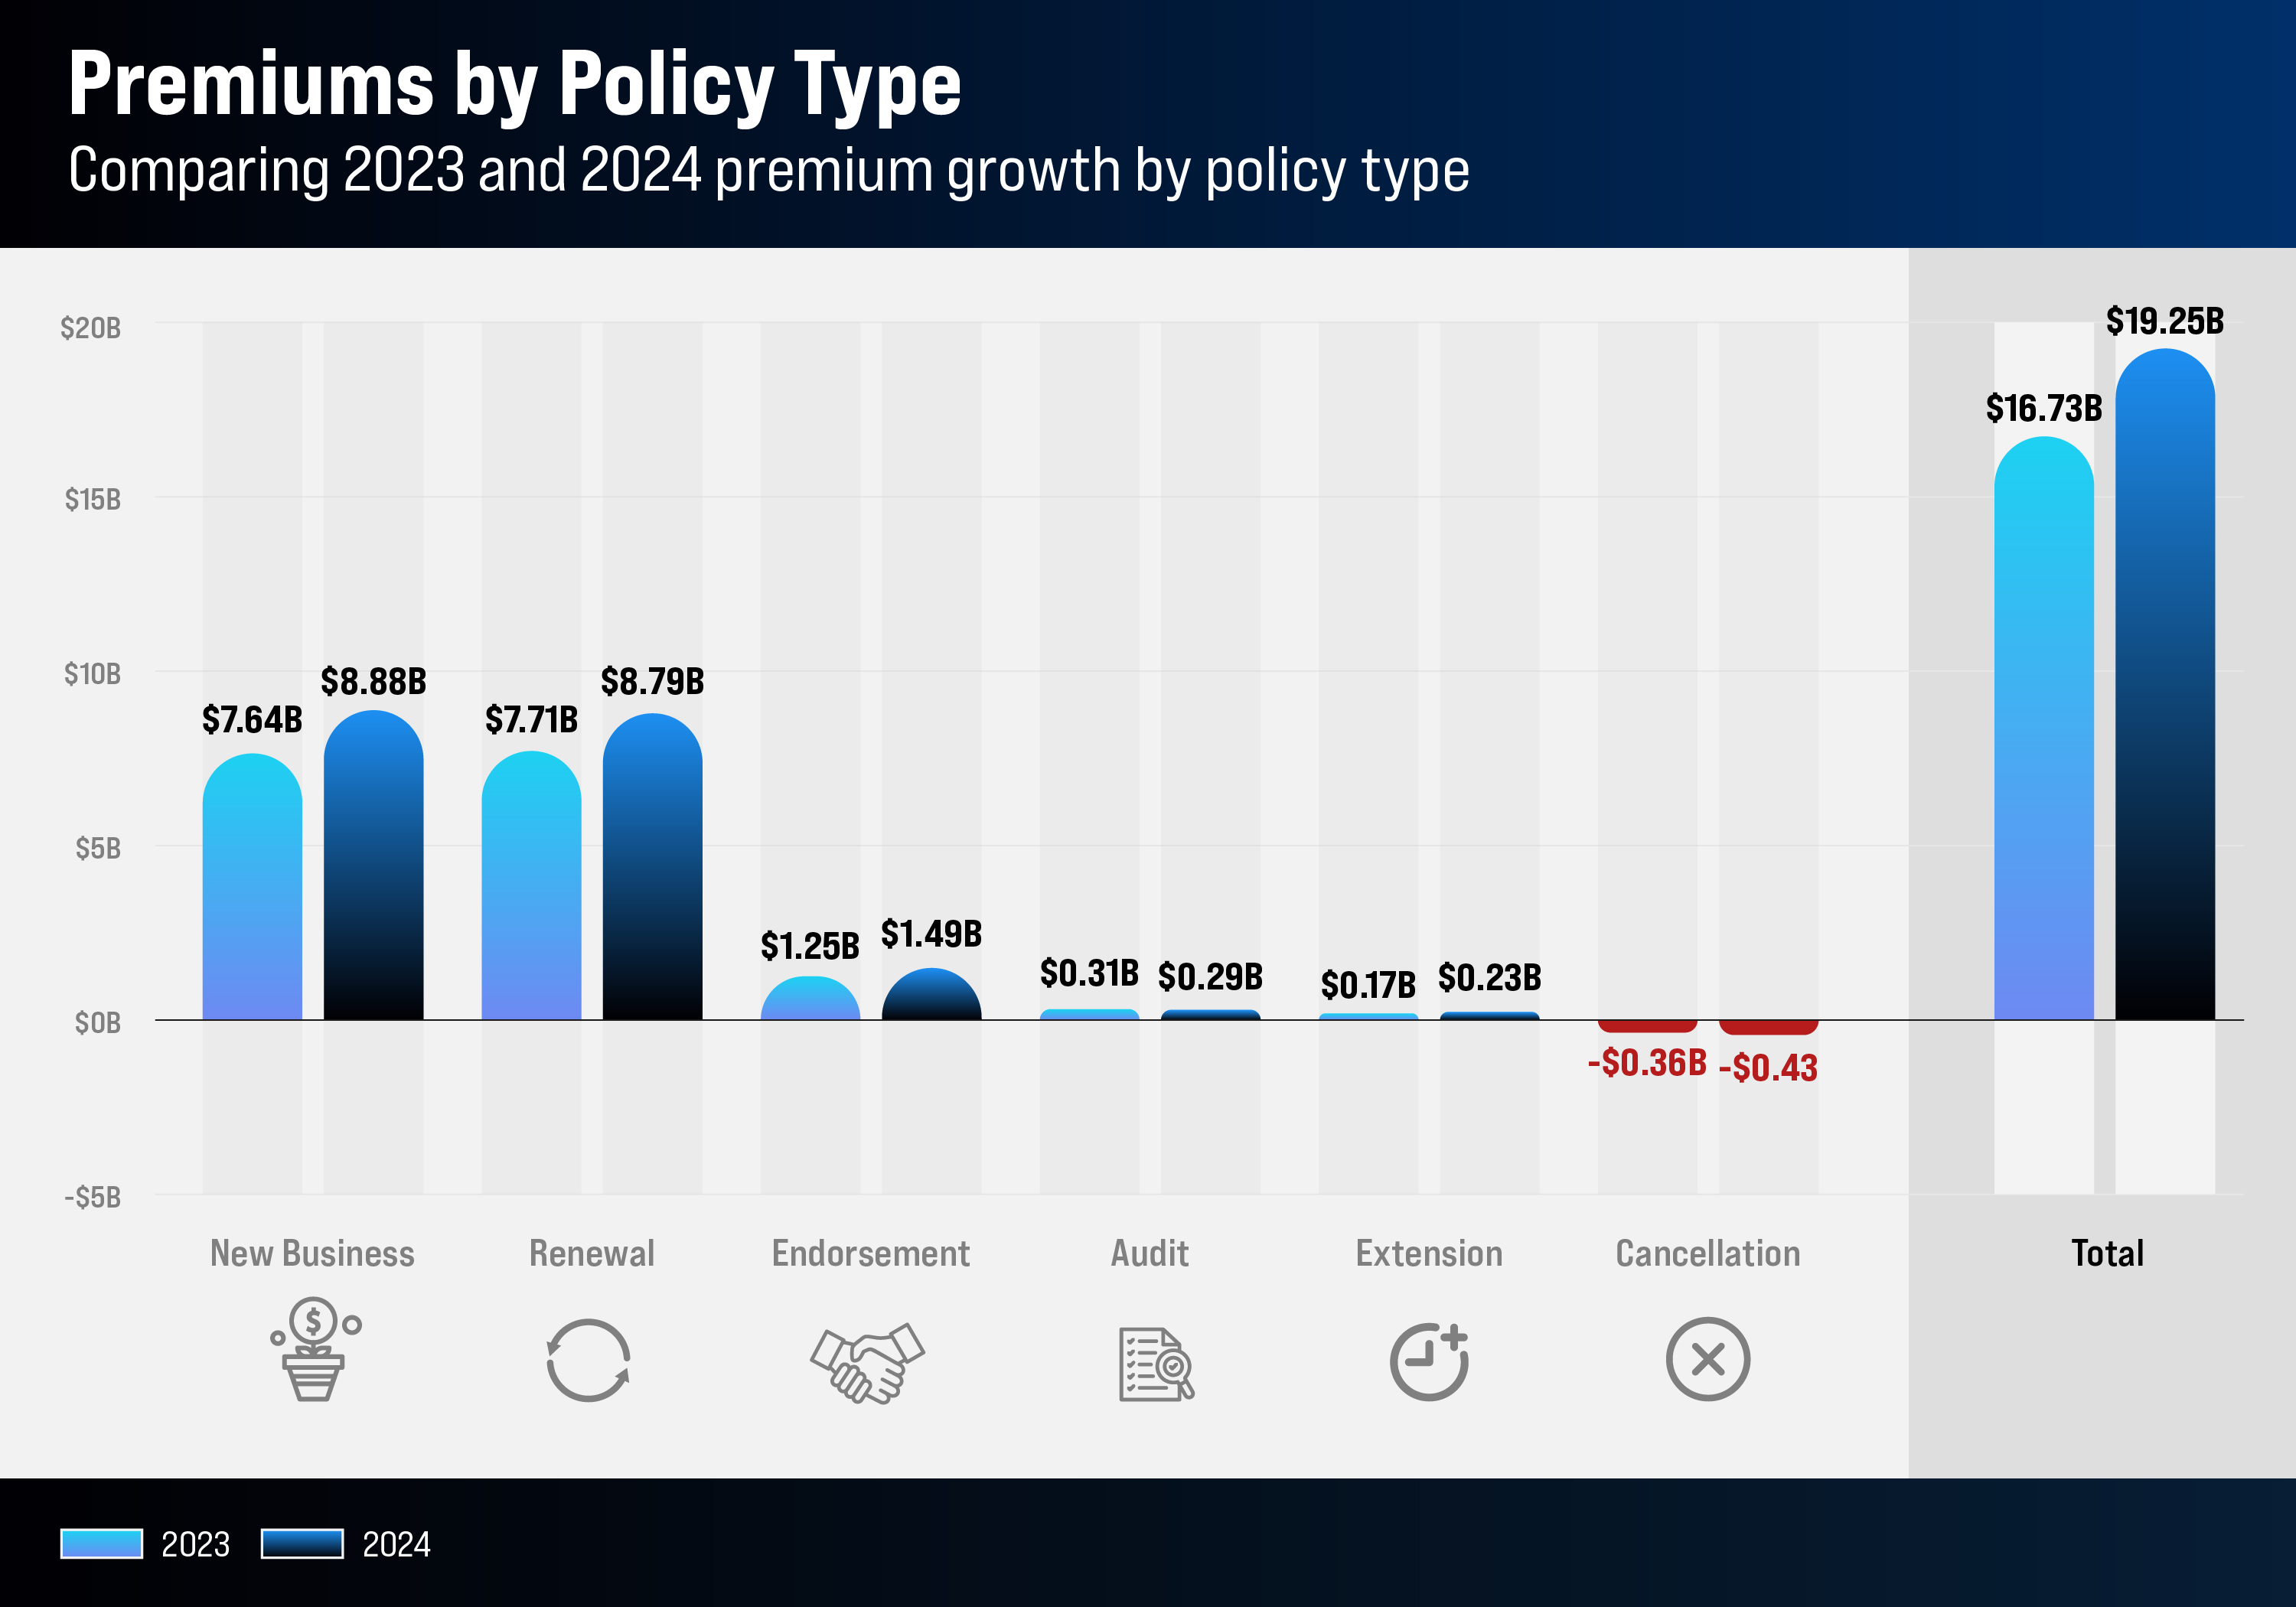
In 2024, new business, renewals, extensions and endorsements all increased, while audits and cancellations declined—further signaling the market’s expansion.
The California Surplus Lines Market Index tracks the average premium per transaction over time, based on policy and endorsement registration dates.
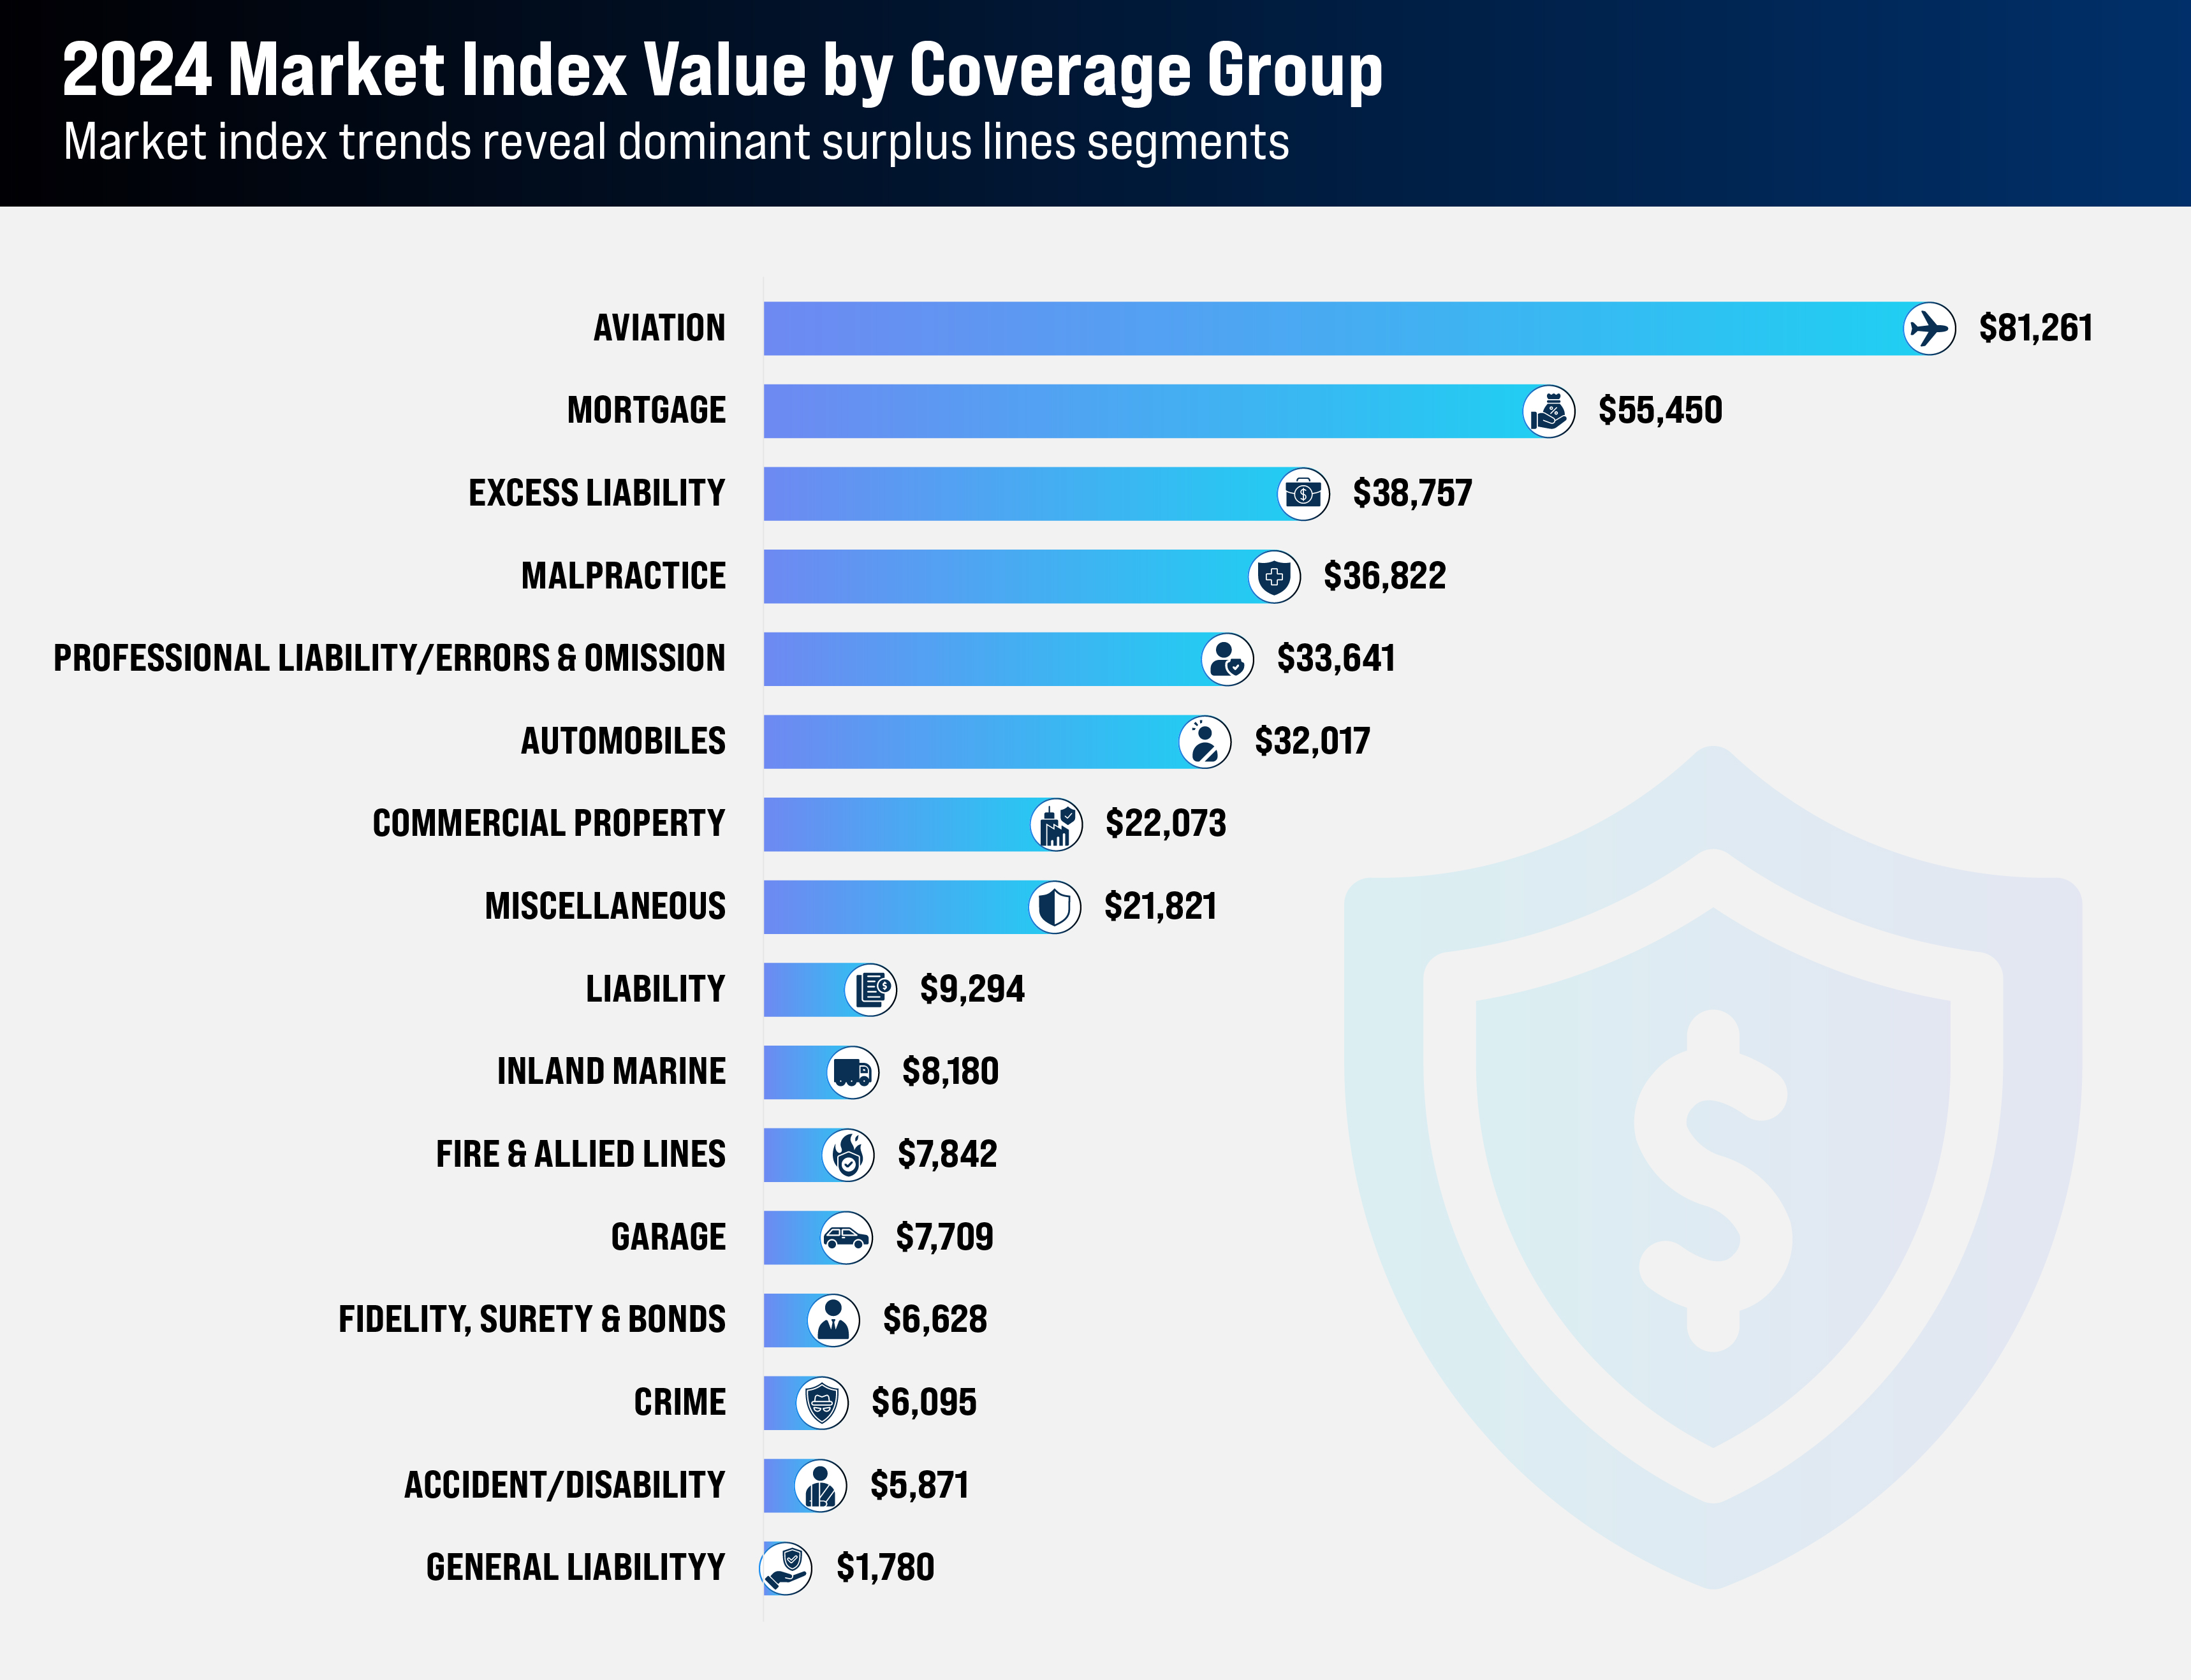
Workers’ compensation leads with a value of $7,858,450, a figure driven by a small number of large clients. Aviation follows at $81,261, with mortgage coverage at $55,450.
At the other end of the spectrum, general liability recorded the lowest SL Index value at $1,780, while accident/disability was slightly higher at $5,871.
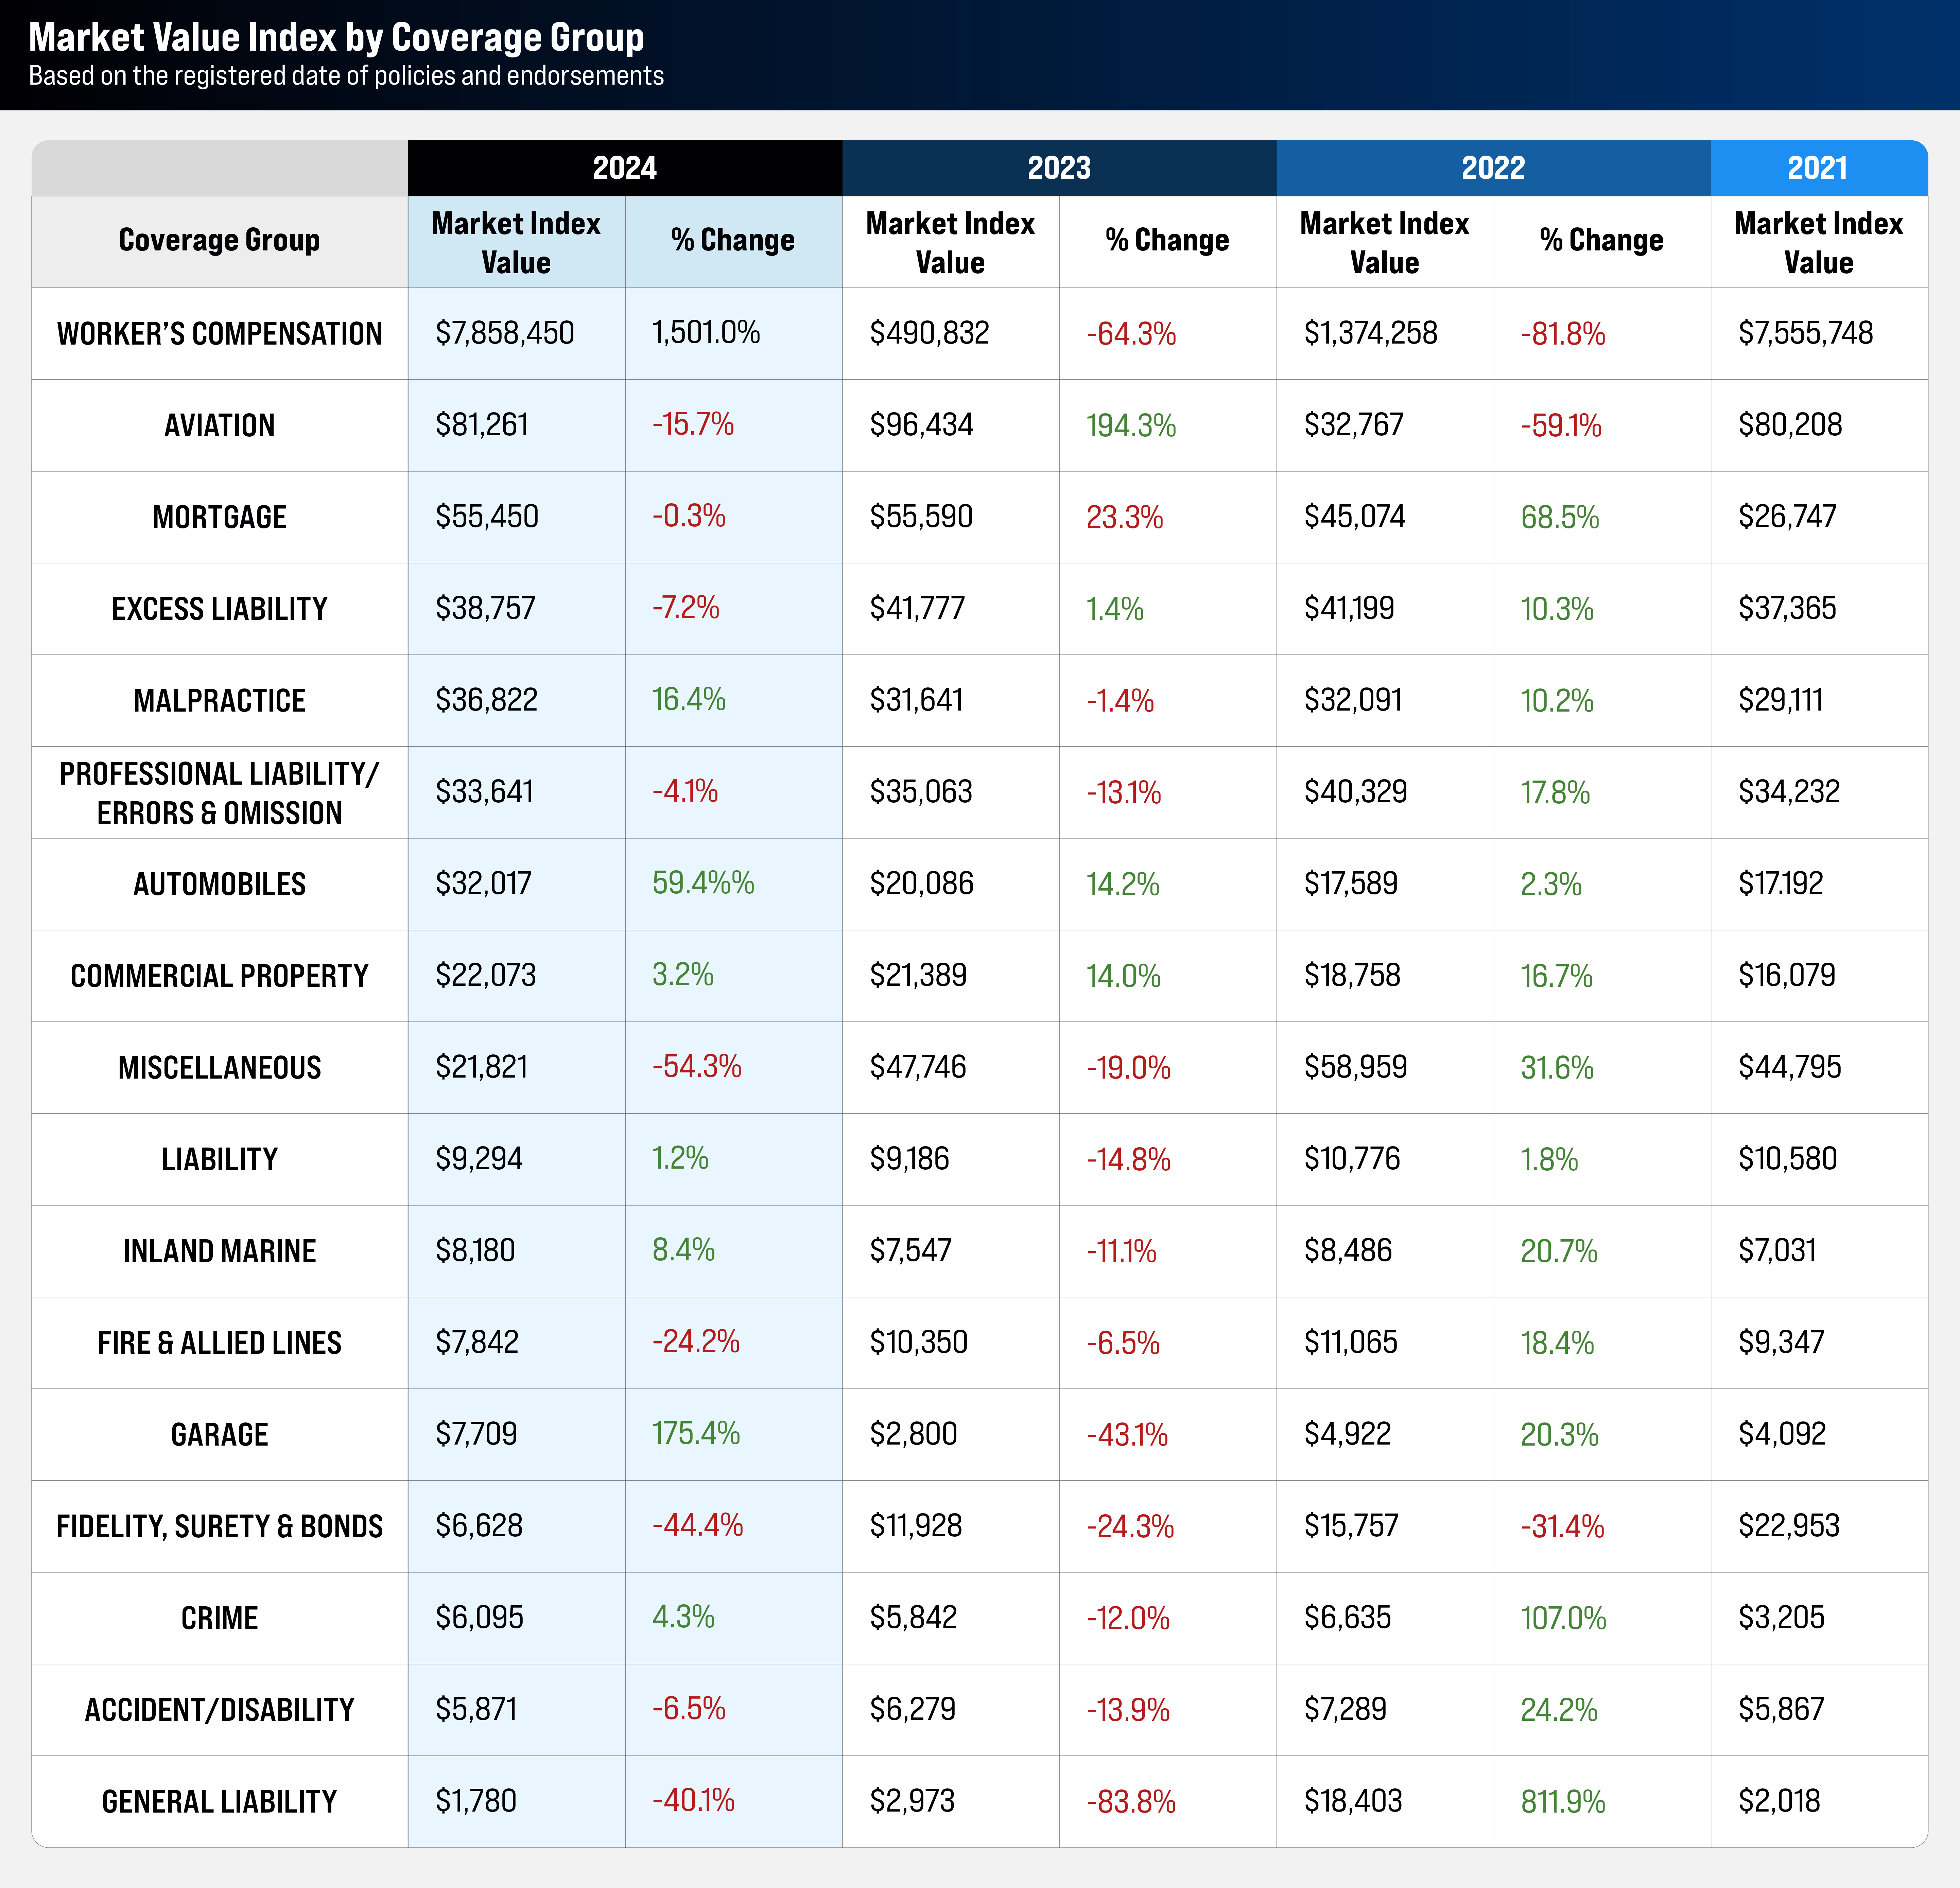
The excess workers’ compensation segment saw a dramatic 1,501.05% increase in 2024, though this surge was driven by a handful of large policies rather than broad market expansion. California law restricts workers’ compensation coverage to the admitted market, with surplus lines insurers permitted only to offer excess coverage.
“These policies are very rare,” said Michael Caturegli, chief technology and analysis officer at the Surplus Lines Association of California, noting that only a few have been written in the past two years. While the segment’s Market Index Value appears exceptionally high, it reflects a small number of high-premium policies rather than widespread growth.
Excess liability and malpractice insurance segments are experiencing slow but steady growth, with malpractice premiums rising 0.164% in 2024. This trend aligns with increasing litigation and liability awareness, particularly in healthcare and high-risk industries.
To strengthen market share, insurers should prioritize data-driven strategies, enhanced policy offerings and customer-focused services. Staying ahead of litigation trends, regulatory shifts and digital transformation will be key to positioning insurers and brokers as trusted advisors in these evolving sectors.
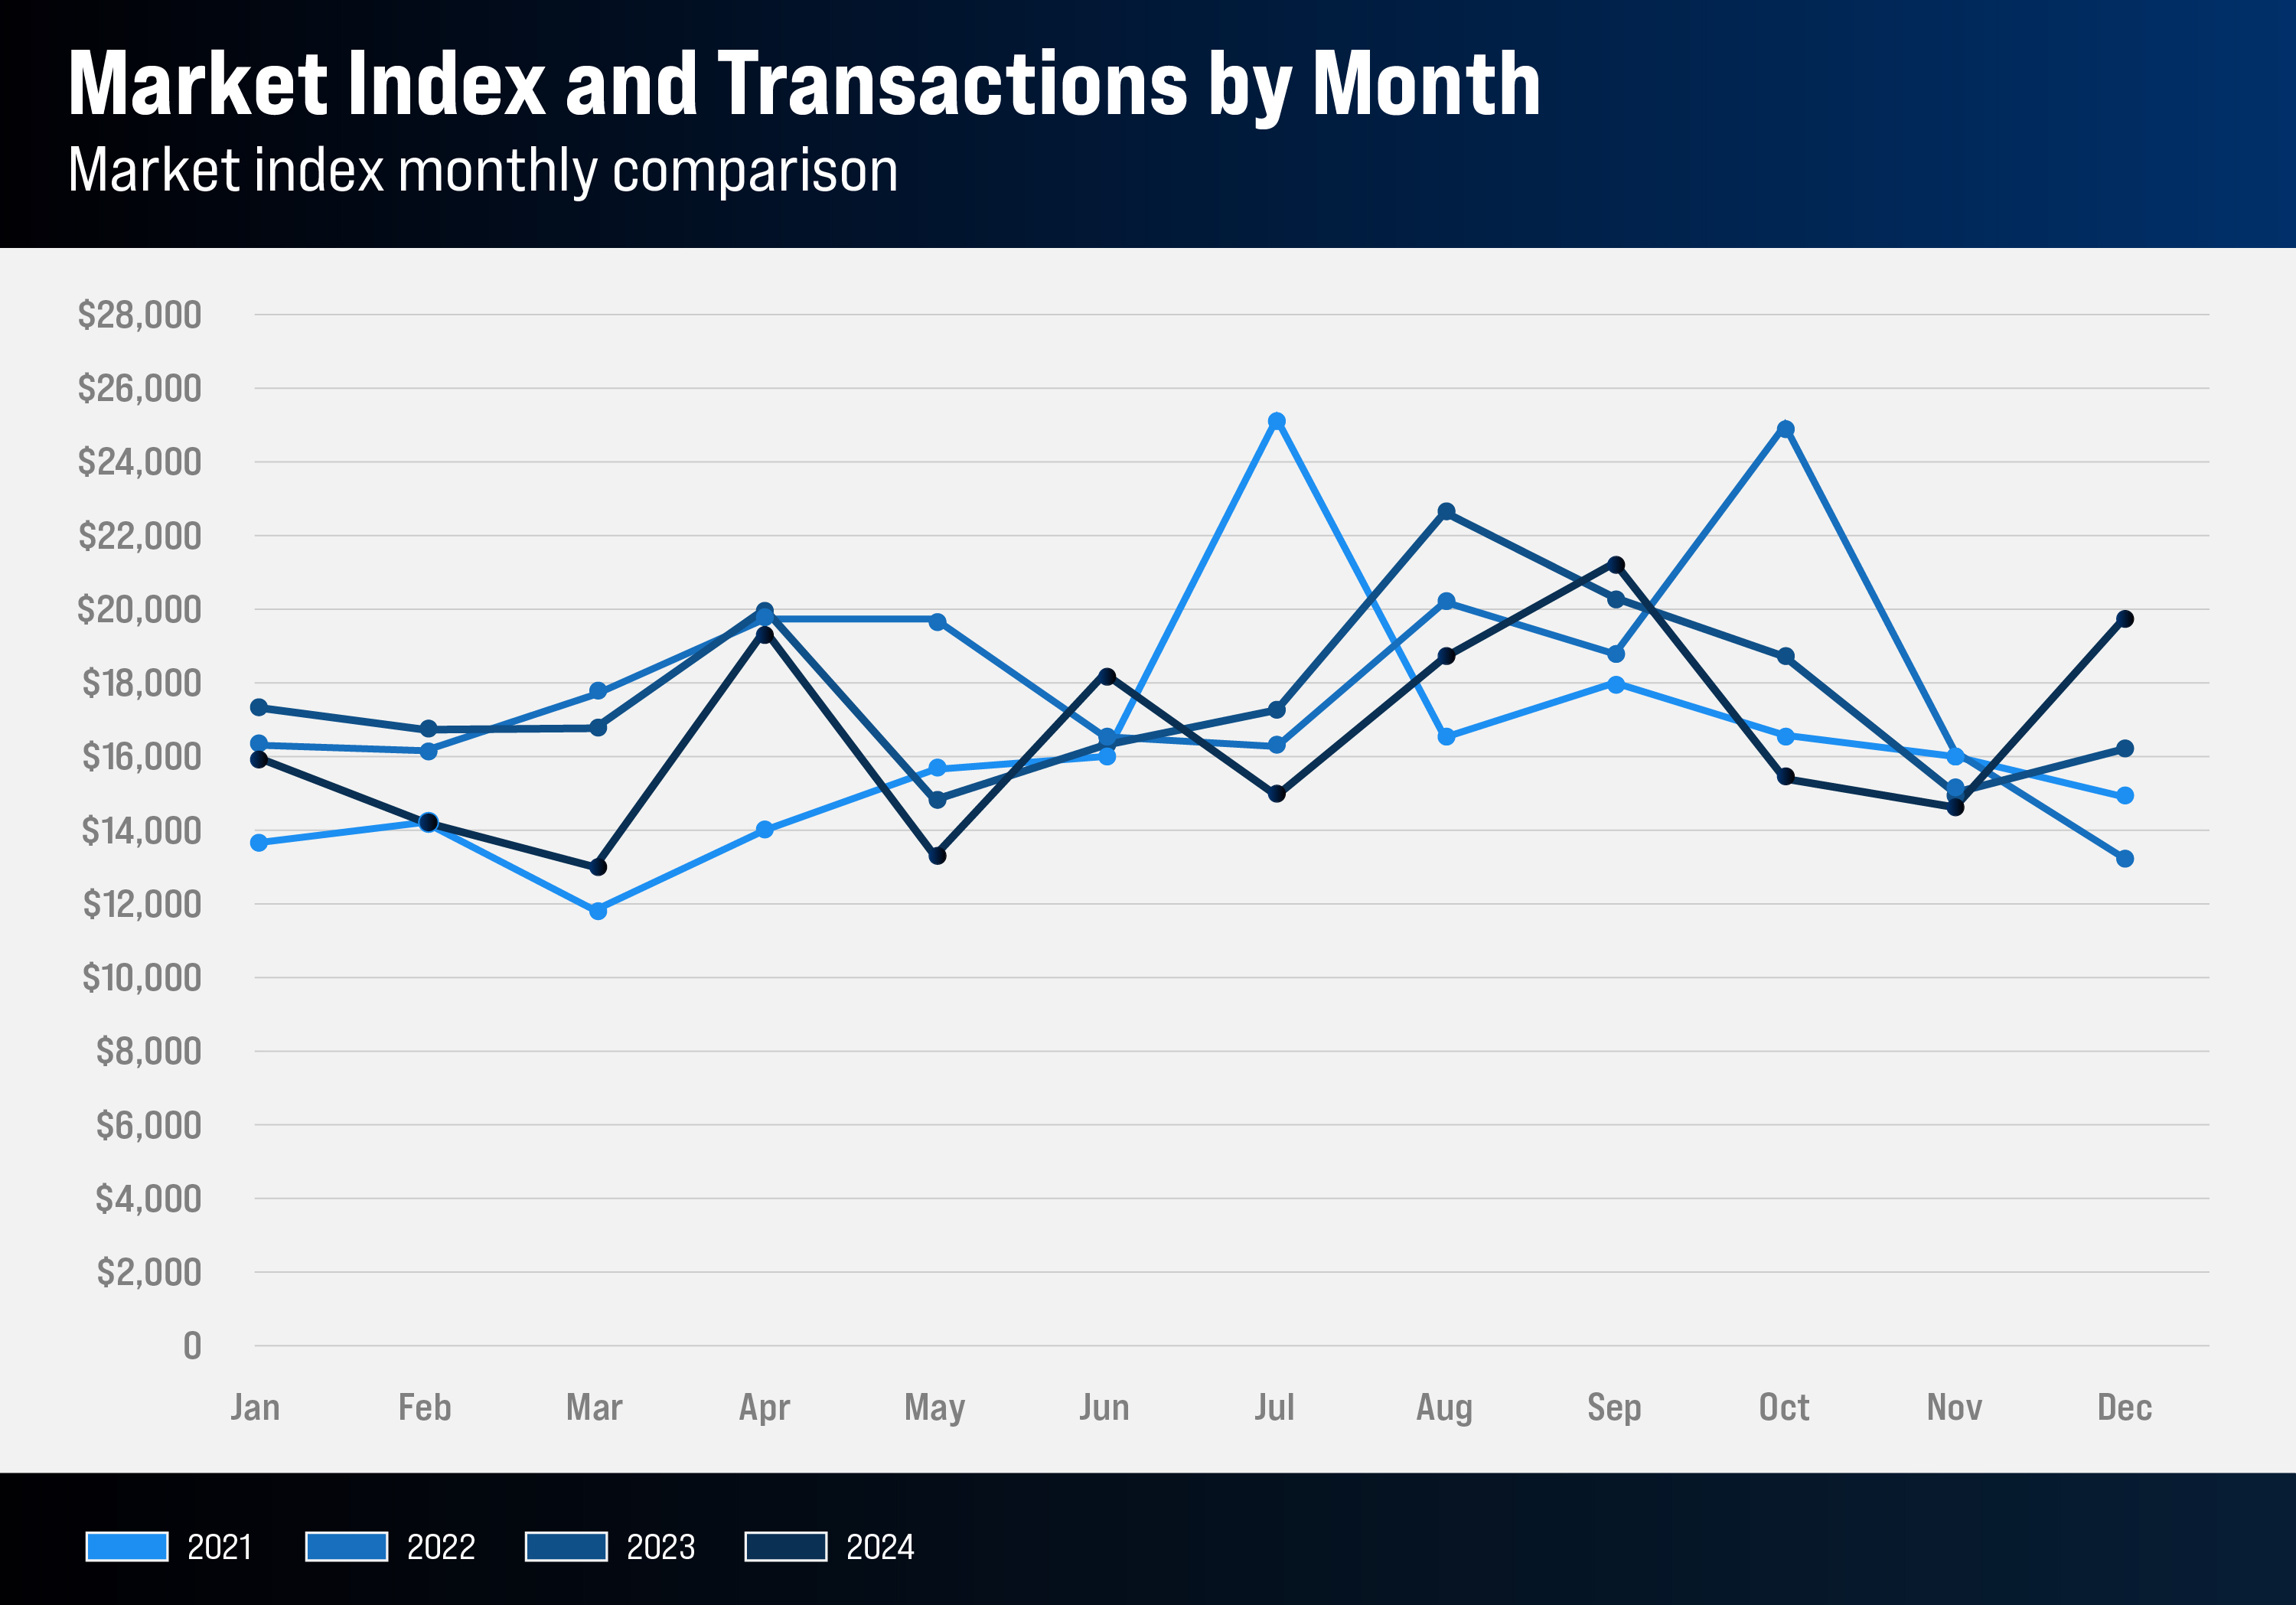
Month-to-month fluctuations in the California Surplus Lines Market Index reflect external forces that shape the insurance industry, including economic shifts, rising demand for specialty coverage, regulatory changes and natural disasters. However, some of this volatility is also driven by the timing of insurers' policy additions and renewals, leading to occasional spikes in activity.
A new multi-year comparison (2021–2024) suggests a gradual stabilization in the market, likely driven by rising insurance costs, increased risk exposure and greater reliance on surplus lines as the admitted market struggles with capacity.
Recurring mid-year spikes suggest a pattern of premium increases, possibly linked to policy renewals in specific industries and seasonal risks such as wildfires. Conversely, end-of-year dips likely reflect businesses postponing coverage decisions until the next fiscal year.
2021 recorded the lowest premiums and the most volatility, likely due to COVID-19’s market disruptions. In contrast, 2024 began with significantly higher premiums, possibly driven by increased risk exposure and more complex surplus lines policies.
Since 2023, the market has shown more stable trends, pointing to consistent underwriting and pricing strategies. While premiums have fluctuated, the overall baseline has risen. In 2021, the average monthly premium hovered between $13,000 and $15,000. By 2024, it consistently exceeds $16,000–$19,000, with fewer sharp spikes than in 2022 and 2023.
This upward trend underscores the market’s resilience and highlights the need for insurers to continuously adapt their pricing strategies and product offerings to remain competitive while meeting policyholder needs.
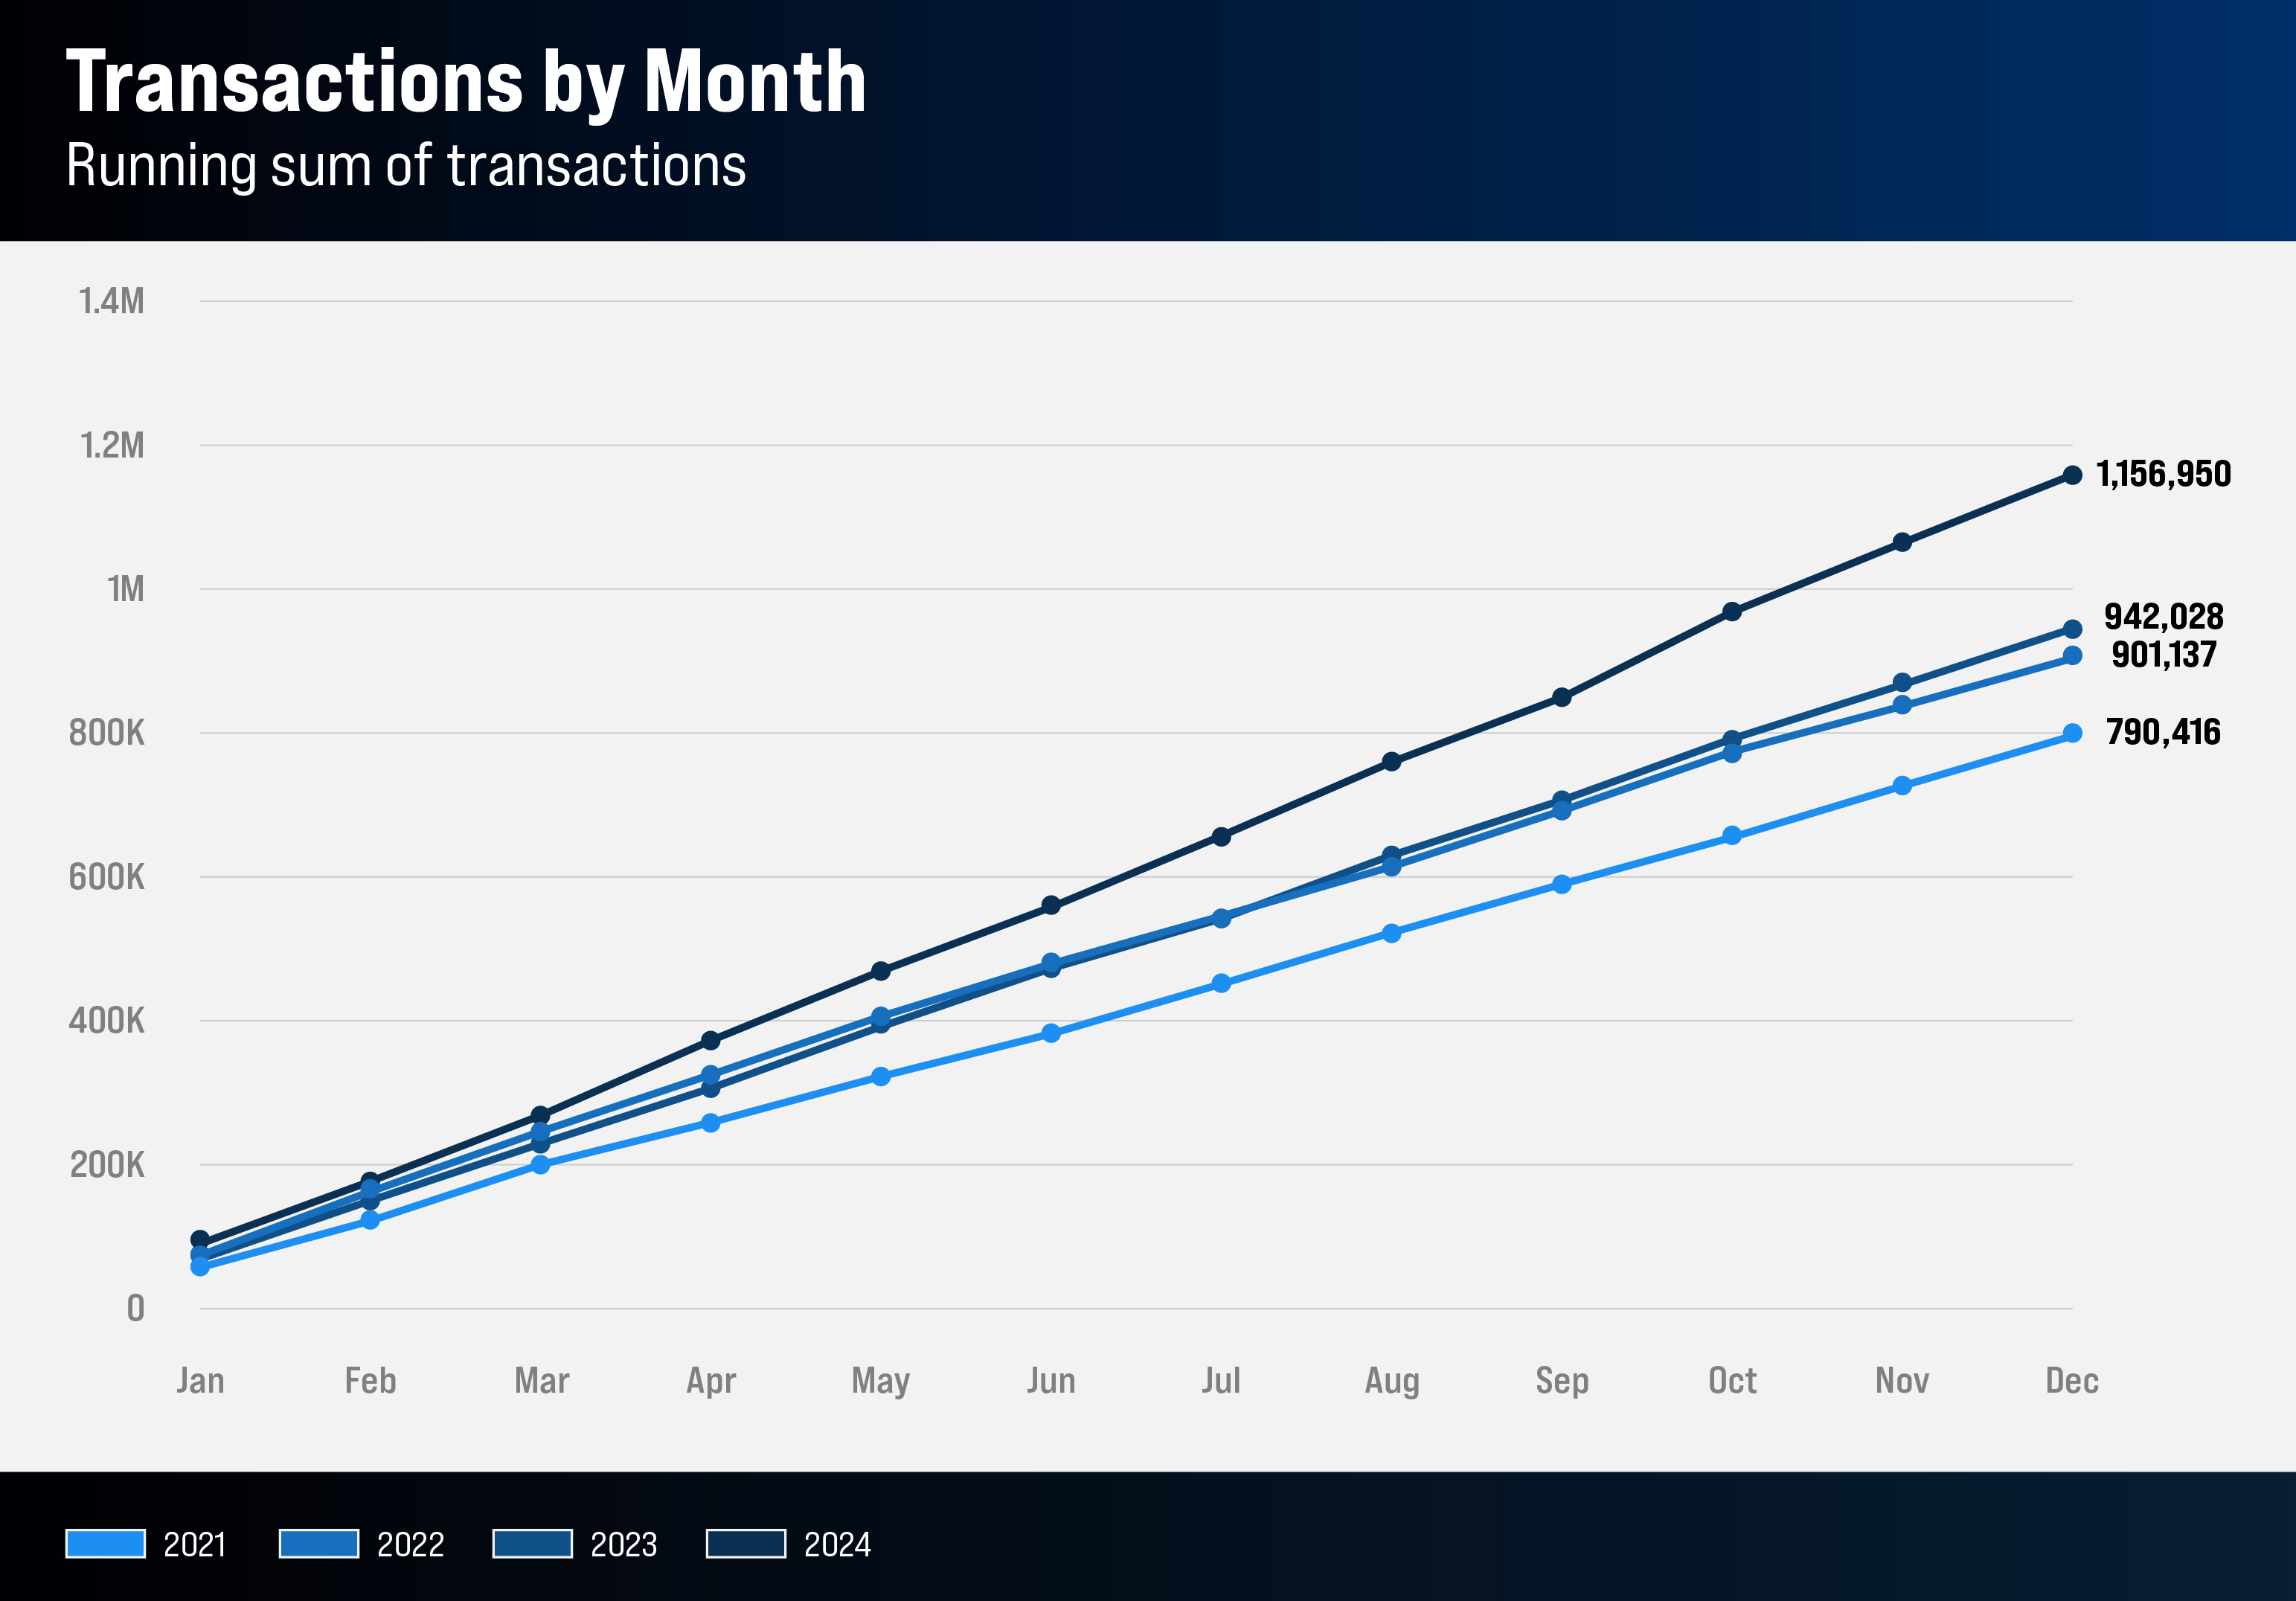
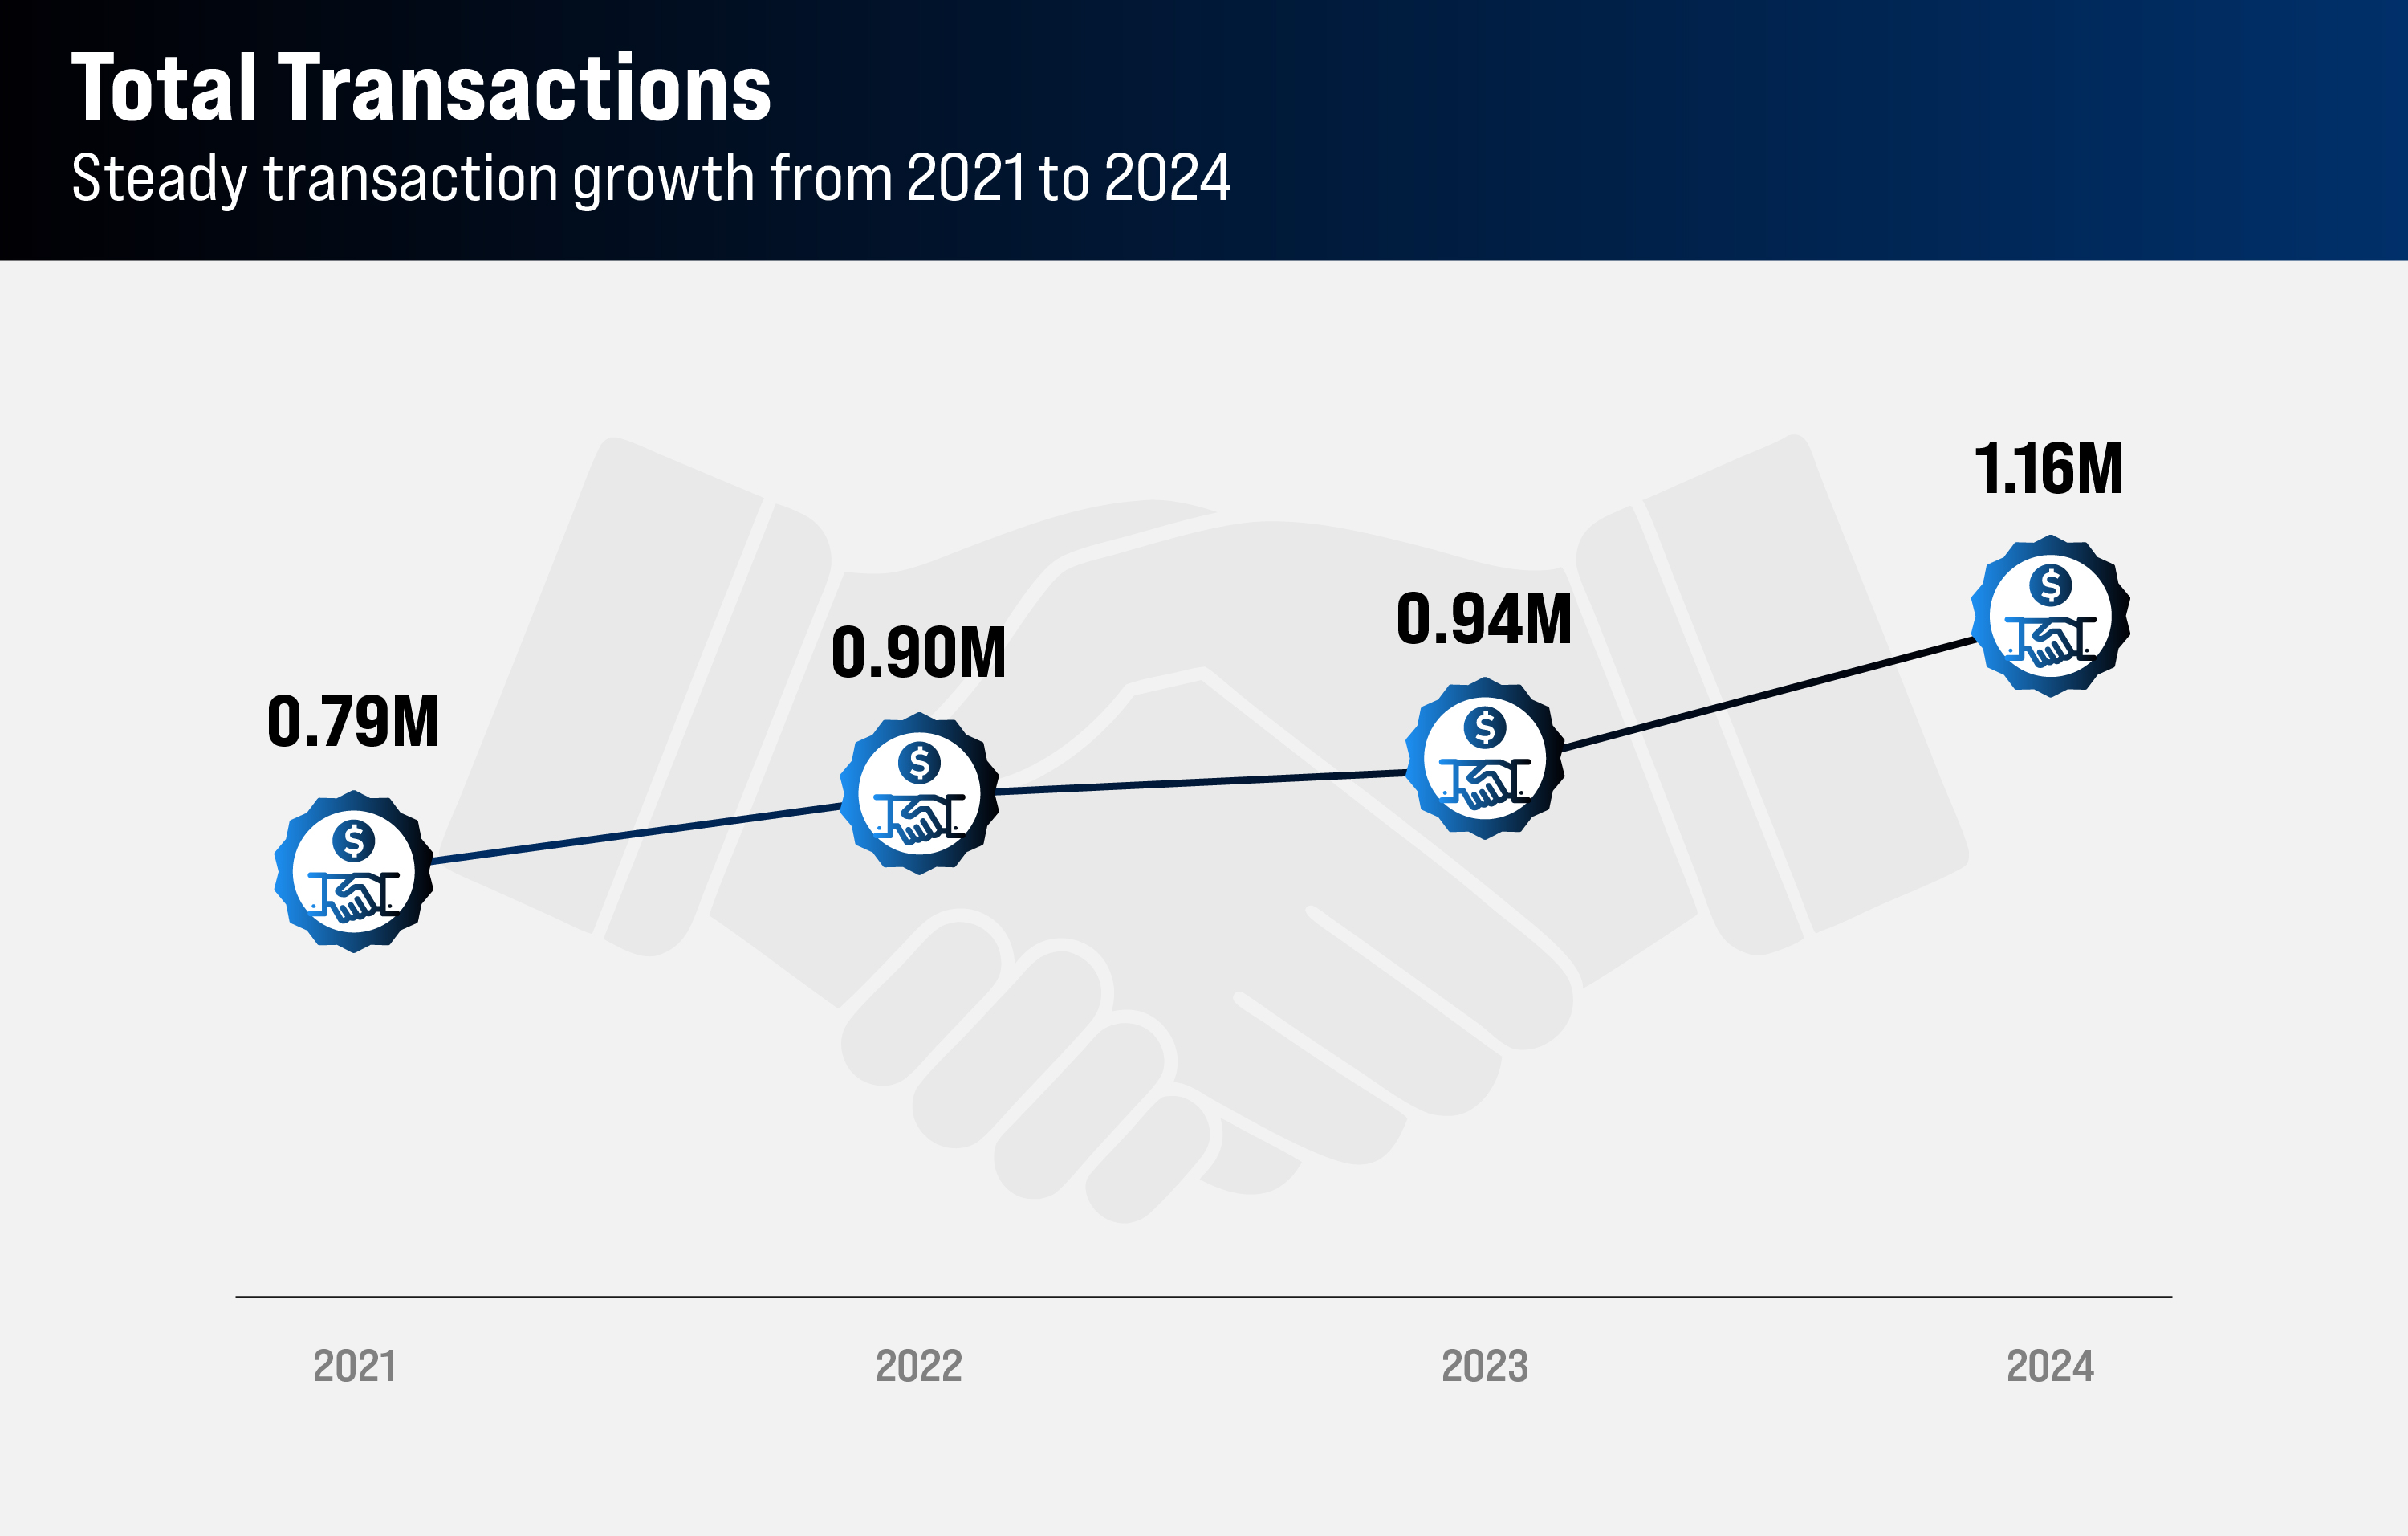
Transactions in the surplus lines market have shown steady increases, with every month of 2024 surpassing the previous three years. This upward trend underscores the rising demand for surplus lines insurance, driven largely by the admitted market’s refusal to cover high-risk policies, which in turn pushes more business into the surplus lines sector.
As demand continues to grow, brokers must prepare for sustained increases across various lines of coverage. Focusing on capacity and operational efficiency will be key to managing this higher transaction volume. Insurers, meanwhile, will need to streamline underwriting processes and invest in digital tools to handle the growing workload effectively.
While the California surplus lines market has steadied in recent years, insurers may shift their focus from aggressive growth strategies to enhancing profitability, customer retention and product innovation. Brokers, on the other hand, should consider diversifying their portfolios to sustain growth in a more competitive and mature market.
For 2025, insurers and brokers should prioritize:
By adopting these strategies, market players can capitalize on the expanding surplus lines sector while maintaining profitability and staying competitive in an evolving market landscape.
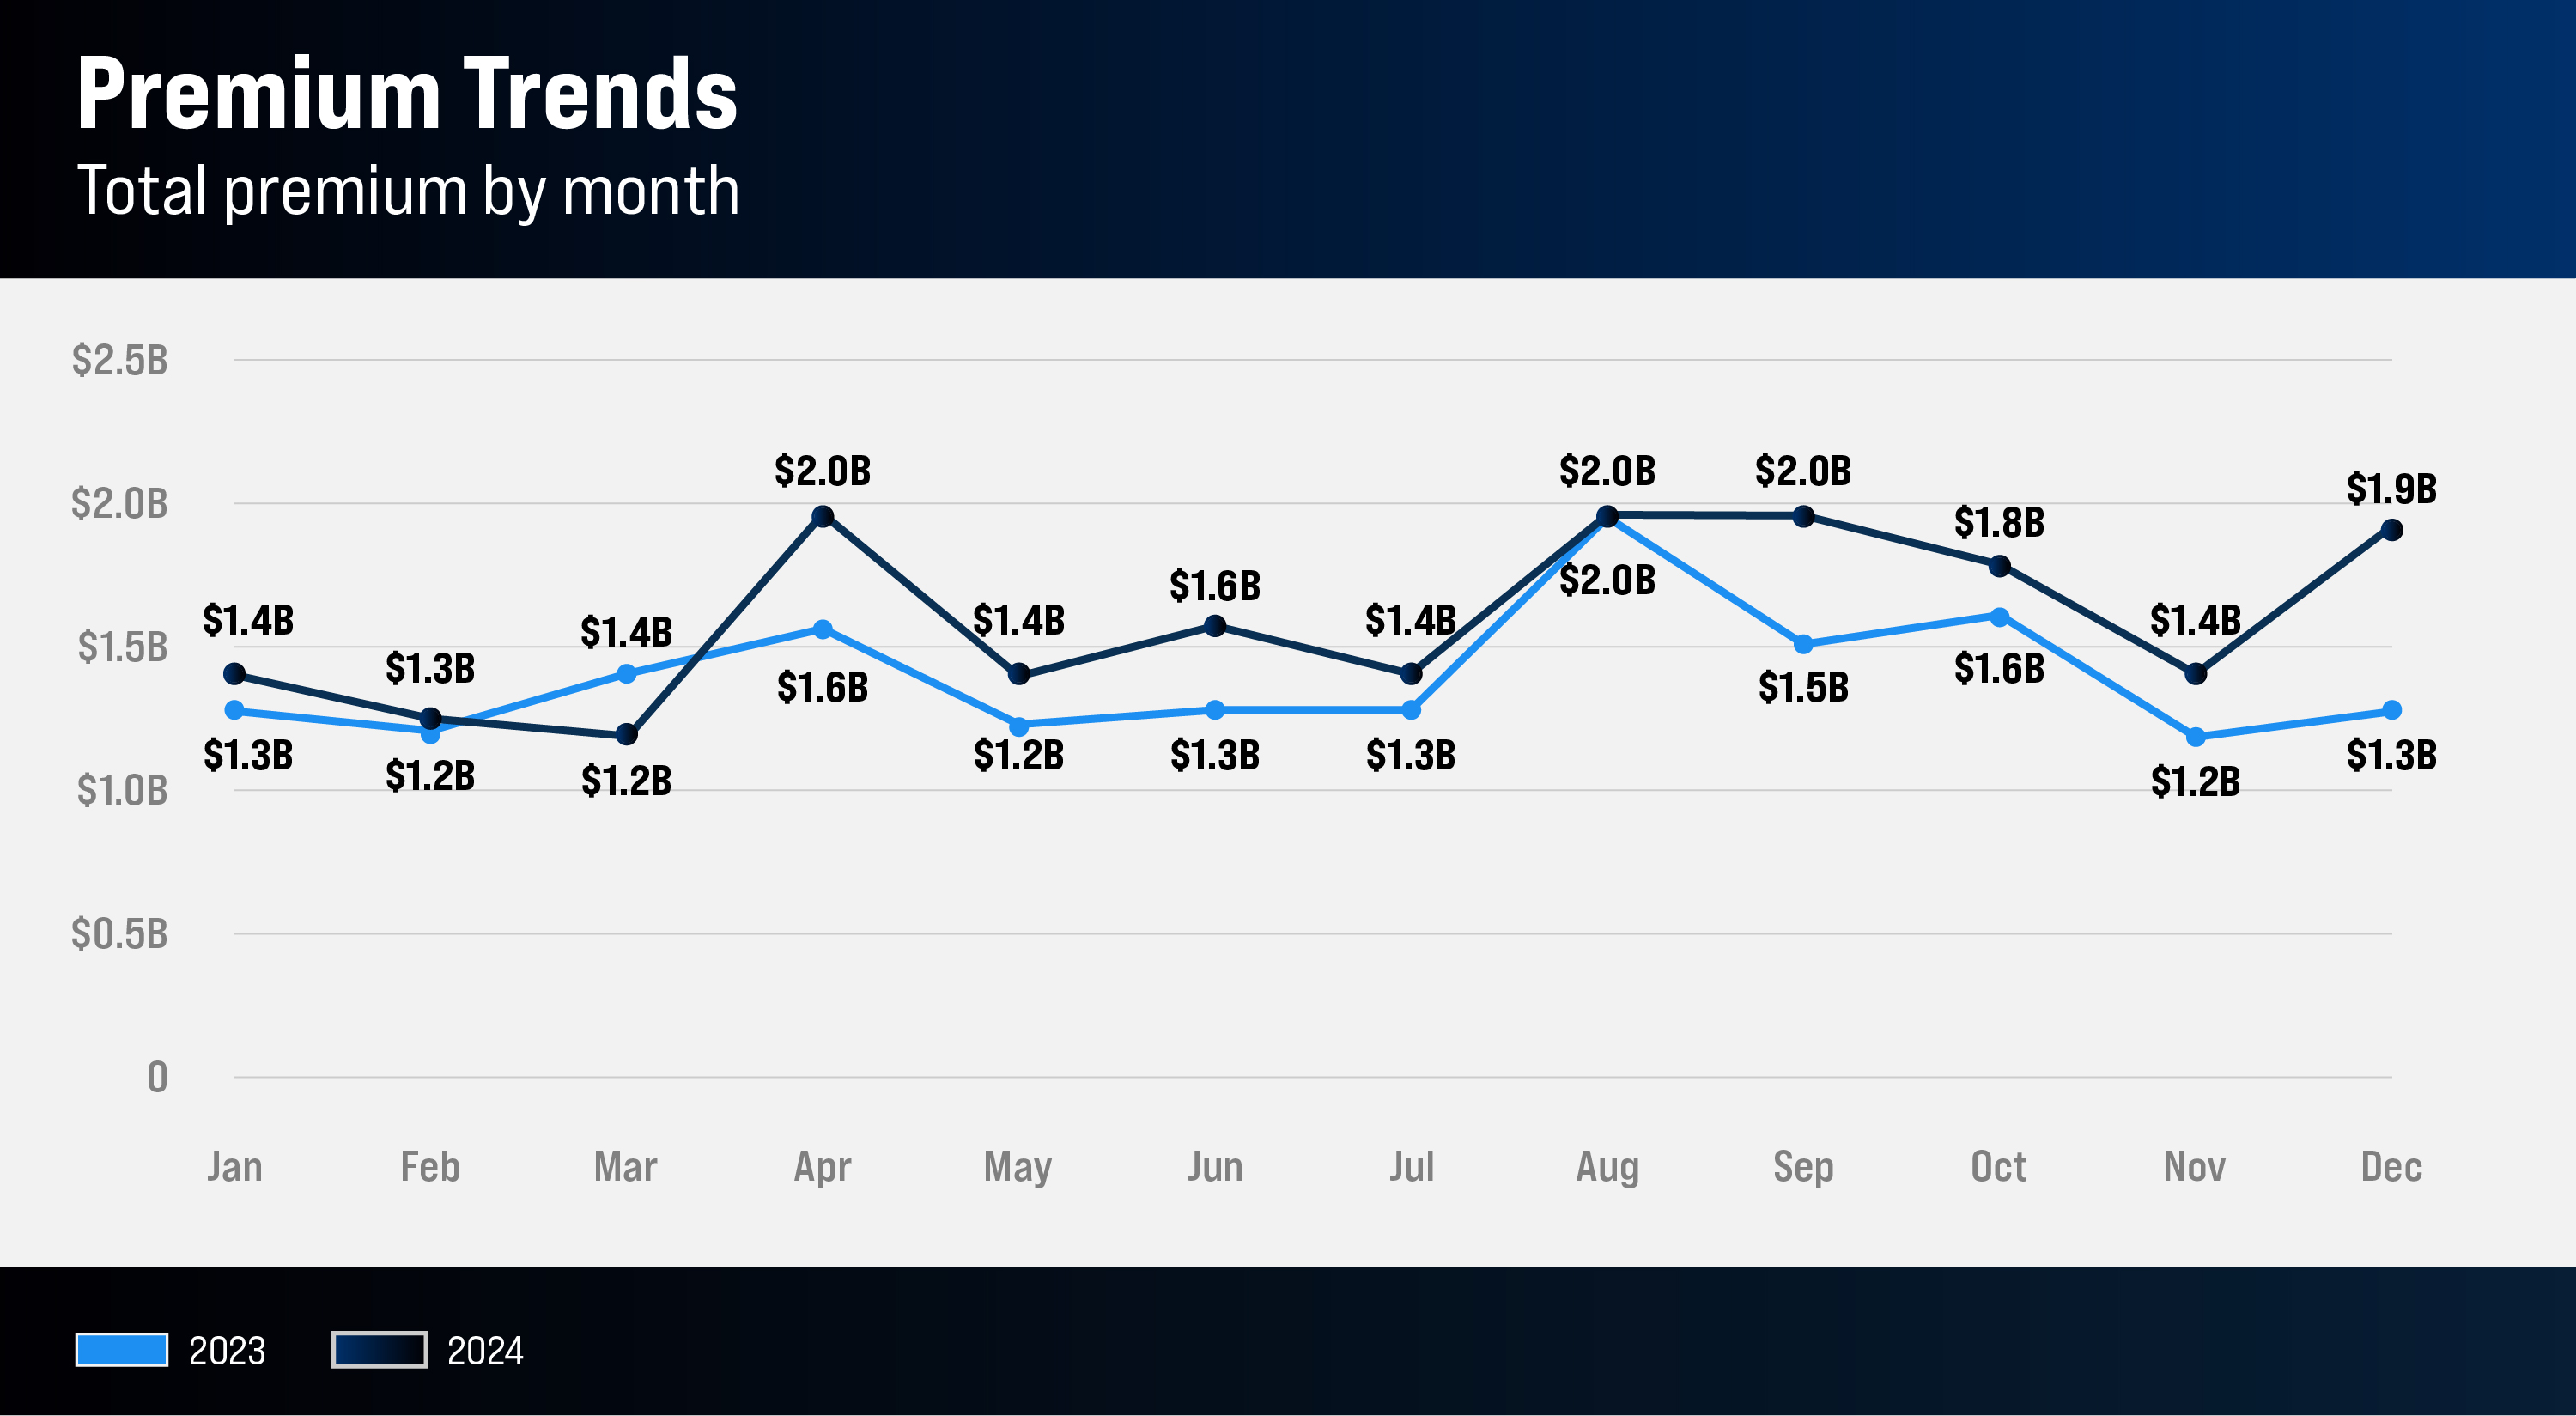
The average premium for December 2024 stood at $19,750, marking an increase from November’s average of $14,566, but remaining within the range of 2024 averages. Except for March 2024, the total premium for each month in 2024 was either equal to or higher than the same month in 2023.
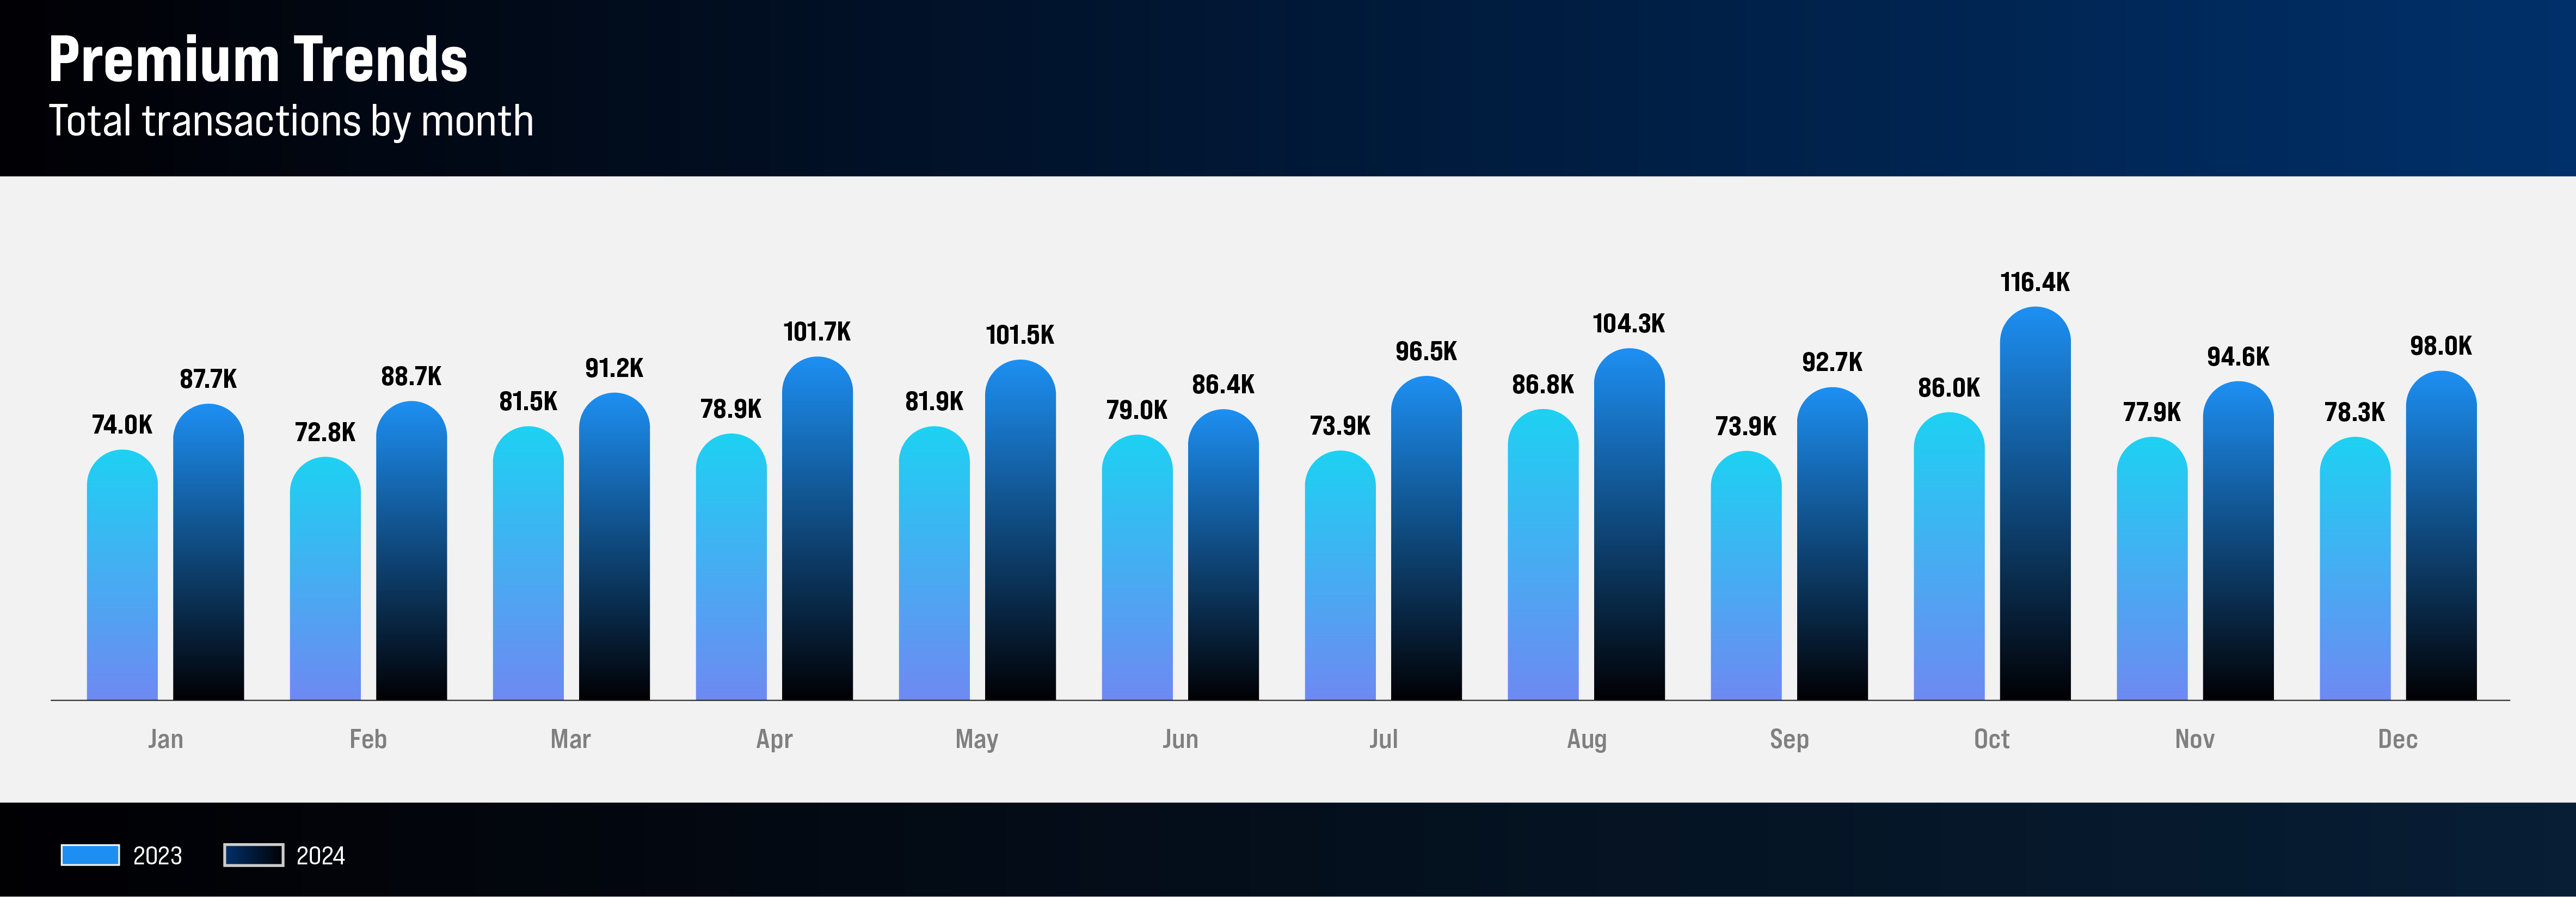
Despite December’s higher premium, October 2024 saw the highest number of transactions, with 116,400 compared to 98,000 in December. Overall, transactions in 2024 outpaced those of 2023 each month, underscoring a significant expansion of the surplus lines market, particularly in personal lines coverage, such as homeowners' insurance.
A notable surge in transactions in 2024 was attributed to new homeowners' policies. California's ongoing struggles with wildfire risks and other environmental challenges have pushed much of the admitted market to deny or cancel homeowners' policies. As a result, the non-admitted market has stepped in to take on this risk.
According to Michael Caturegli, chief technology and analysis officer at the Surplus Lines Association of California, homeowners’ policies have seen a dramatic rise. In Q3, the SLA reported a 330% increase in policies and transactions, along with a 169% increase in premiums for homeowners' insurance.
“Homeowners’ policies are unequivocally increasing, with a 22% rise in transactions this year alone,” Caturegli says. “However, because homeowners' policies generally carry lower premiums than commercial policies, their premium growth is not as steep.”
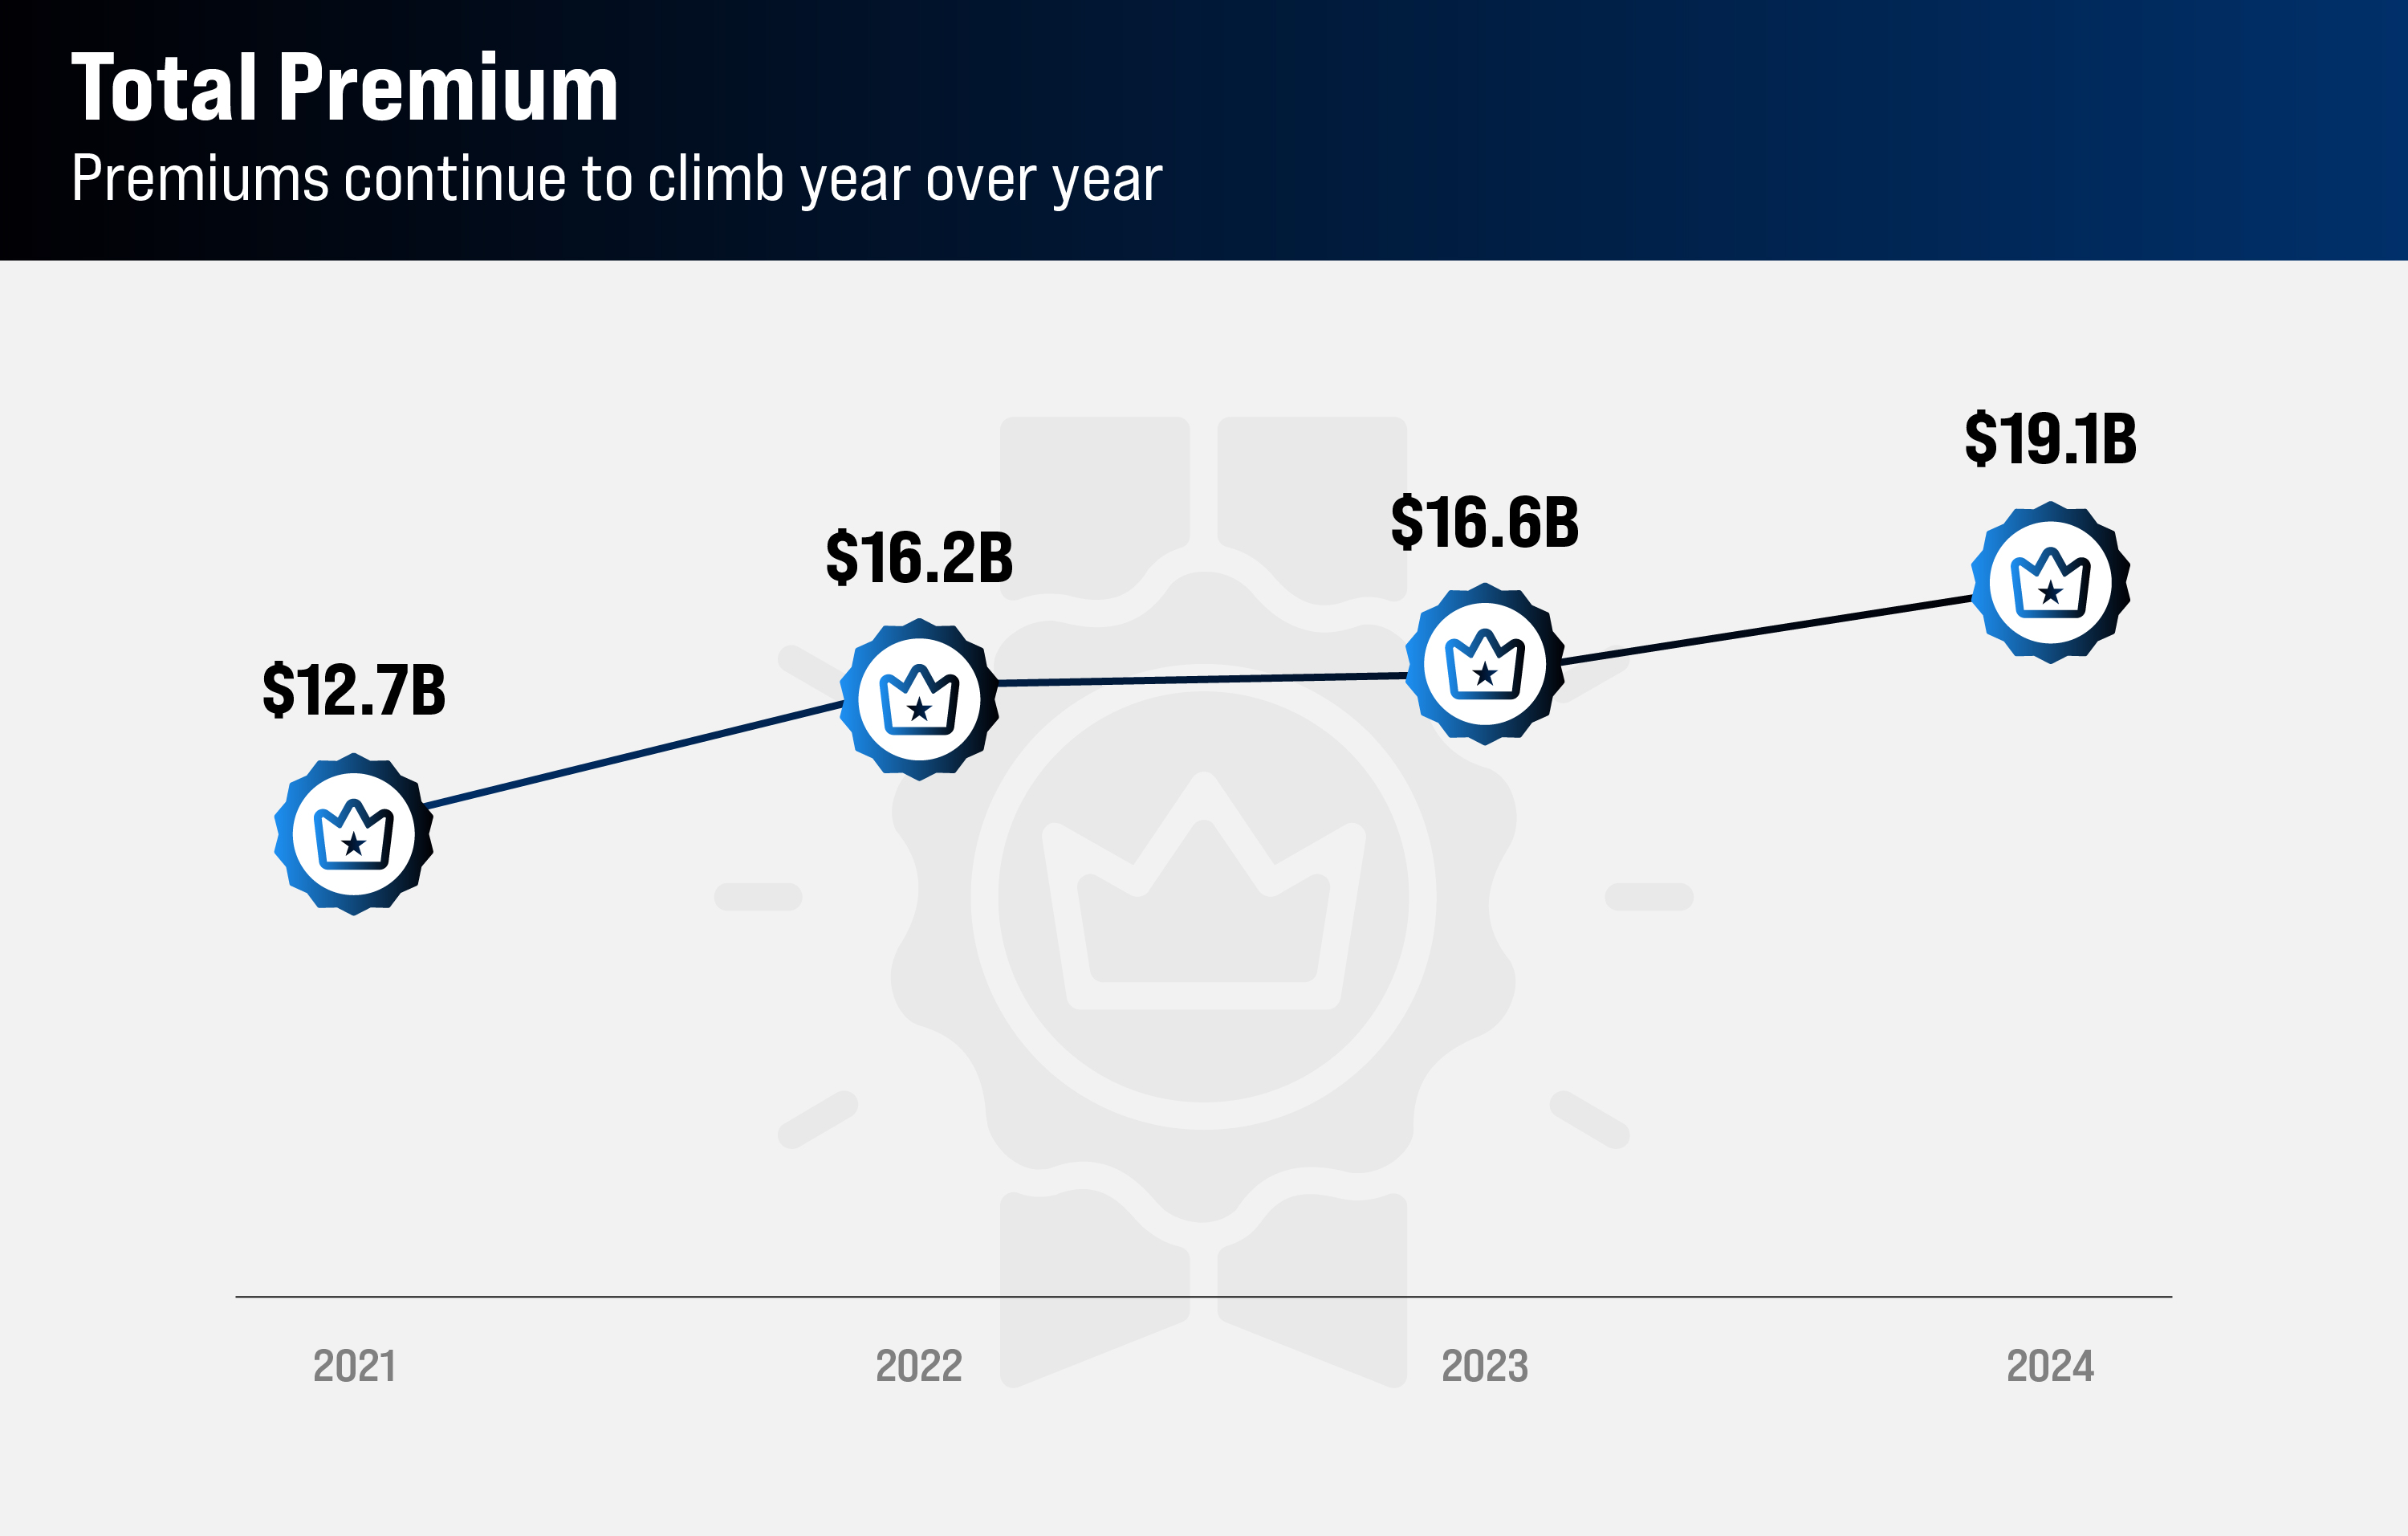
In 2024, total premiums for surplus lines policies in California reached $19,098,648,542, reflecting a 15% increase from $16,634,717,339 in 2023.
Among the 20 insurers with the highest premiums in California, only three experienced a decrease in premiums from the previous year. This trend highlights the ongoing growth and resilience of the surplus lines market in the state.
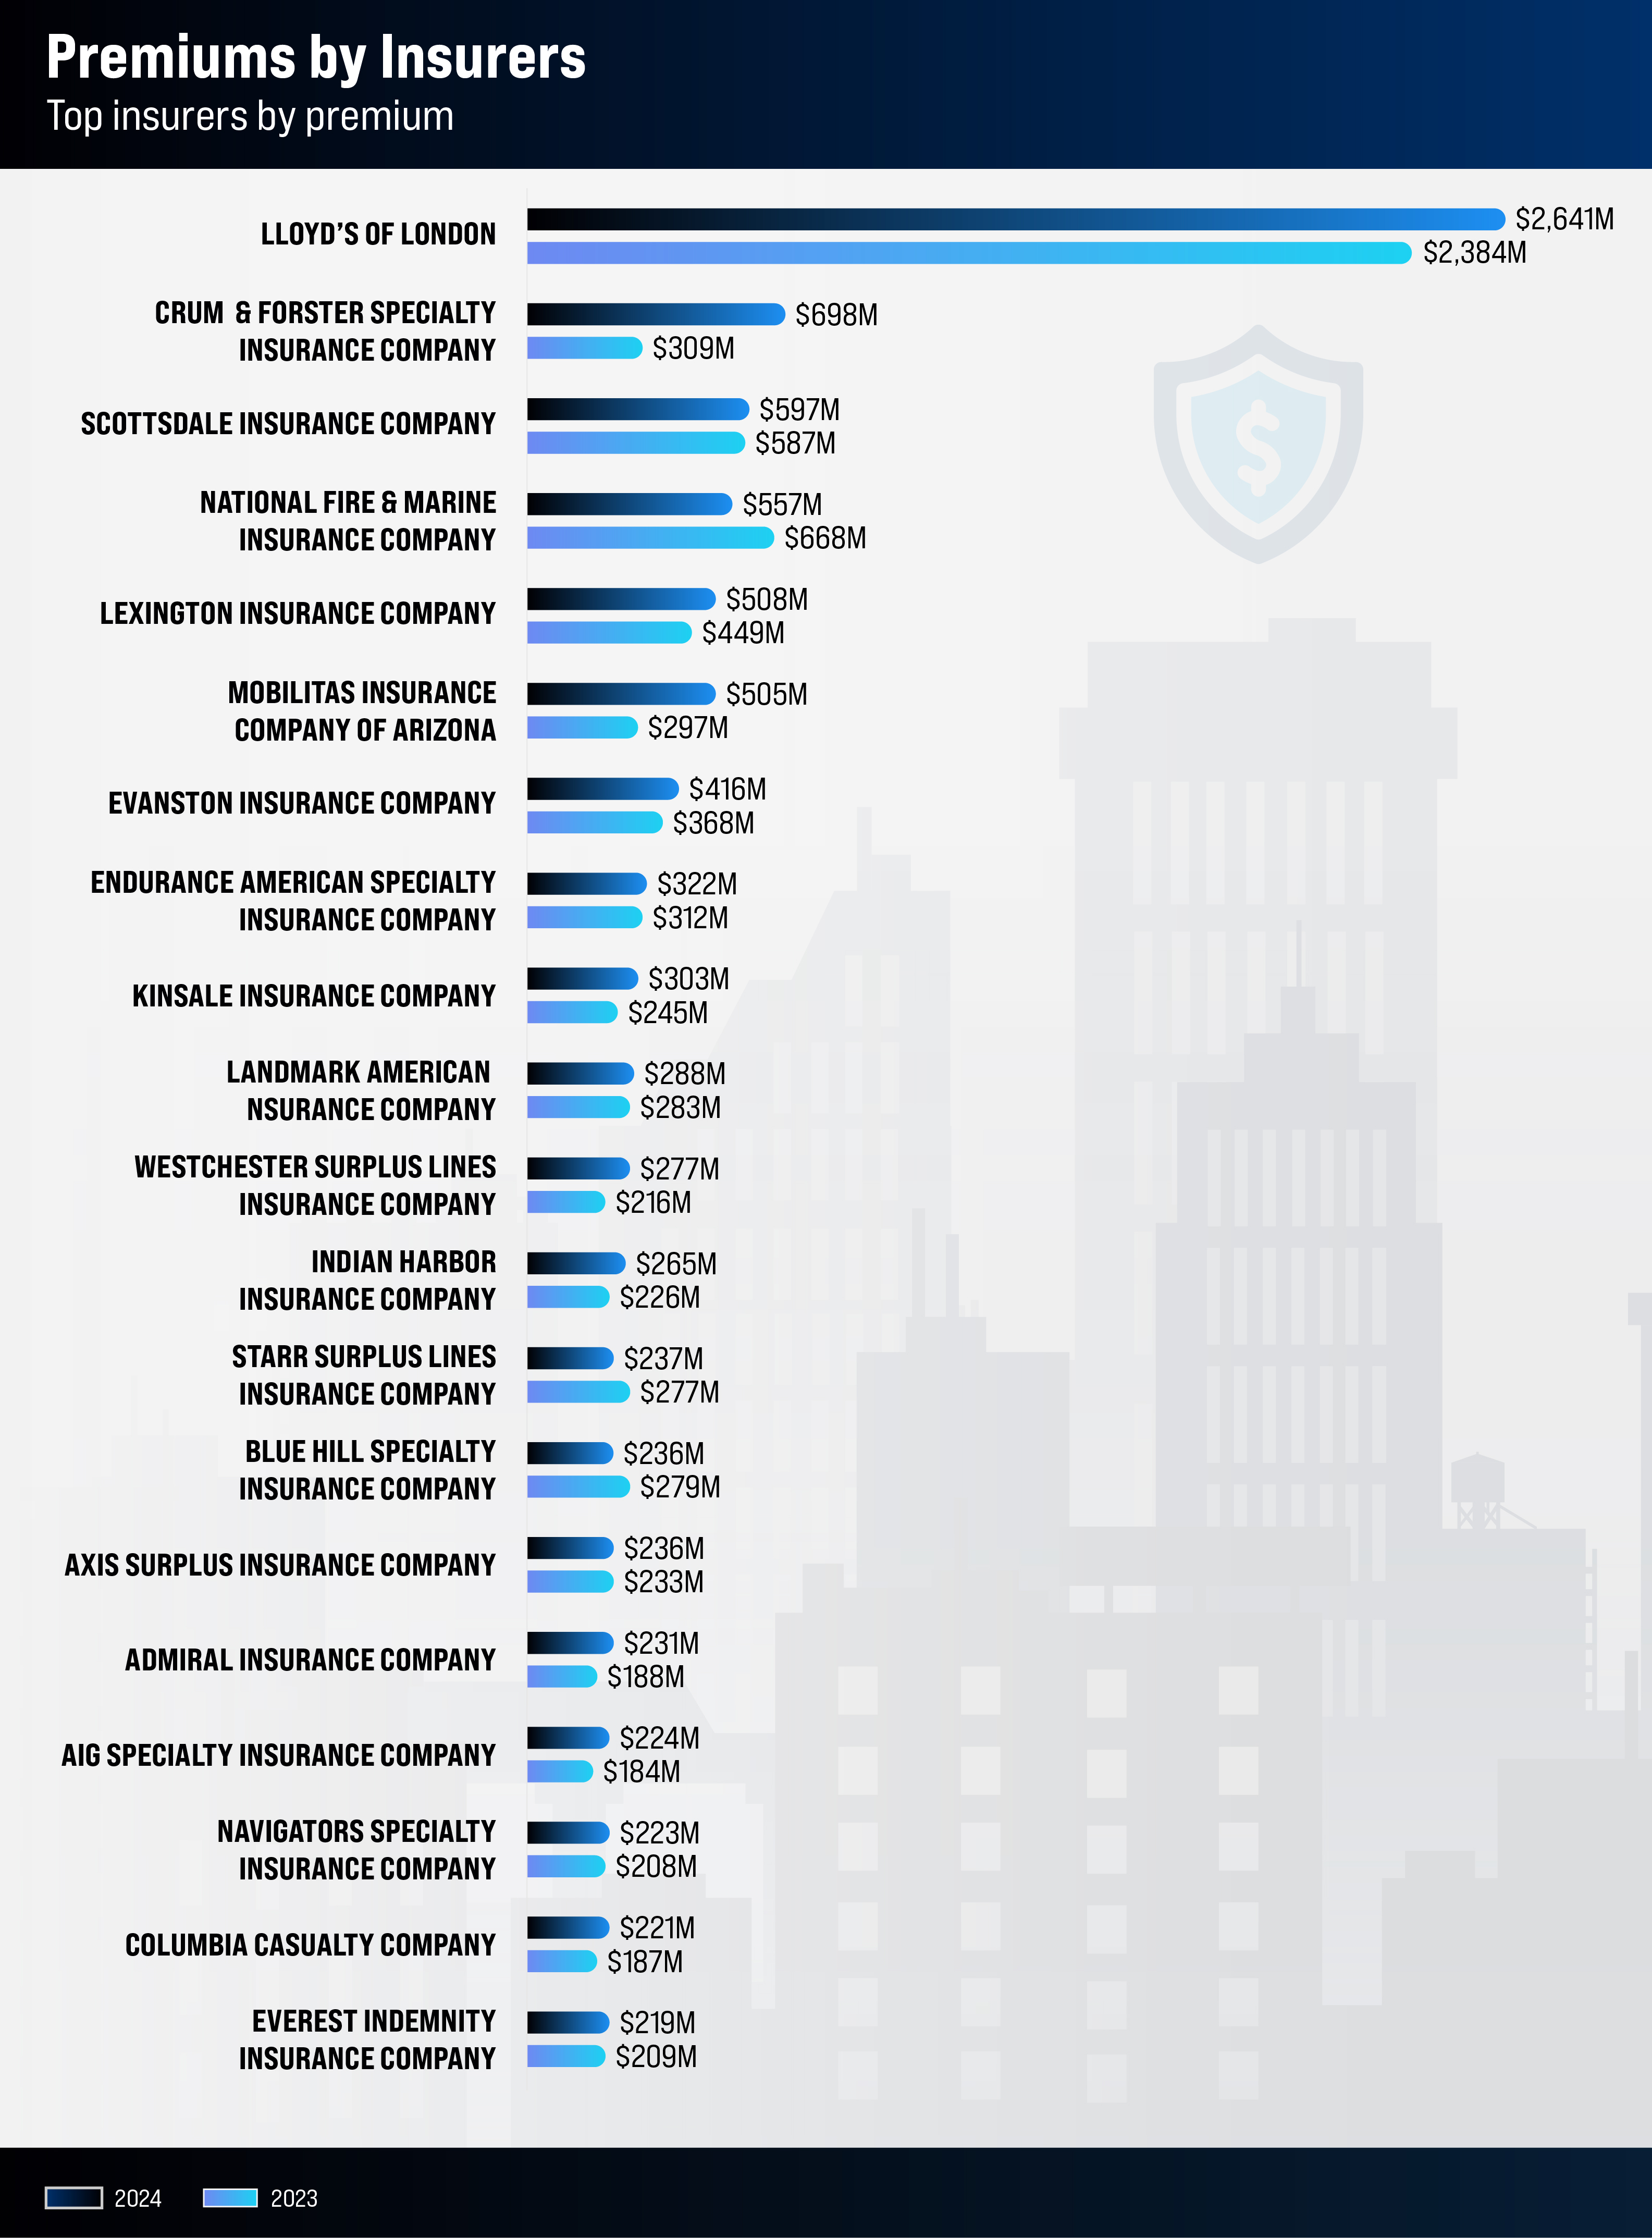
The California Department of Insurance lists 147 approved surplus lines insurers for the state. The top 10 by premium are listed here:
Parent company: Fairfax Financial Holdings Limited
Parent company surplus lines premium: $1,172,610,855
Parent company percent of total premium: 6.14%
Surplus lines premium 2024: $697,543,028
Percent of total premium: 3.65%
Surplus lines premium 2023: $308,712,906
Percent change 2023 to 2024: 126.0%
Date approved: 04/20/1998
Location: Delaware
CEO: Marc Adee
Parent company: Nationwide Mutual Insurance Company
Parent company surplus lines premium: $647,950,606
Parent company percent of total premium: 3.39%
Surplus lines premium 2024: $597,093,821
Percent of total premium: 3.13%
Surplus lines premium 2023: $587,472,354
Percent change 2023 to 2024: 1.6%
Date approved: 06/30/1995
Location: Ohio
COO: George Williams
Parent company: Berkshire Hathaway
Parent company surplus lines premium: $1,184,720,676
Parent company percent of total premium: 6.2%
Surplus lines premium 2024: $557,105,193
Percent of total premium: 2.92%
Surplus lines premium 2023: $668,045,509
Percent change 2023 to 2024: -16.6%
Date approved: 06/30/1995
Location: Nebraska
CEO: Warren Buffett
Parent company: American International Group
Parent company surplus lines premium: $778,410,385
Parent company percent of total premium: 4.07%
Surplus lines premium 2024: $508,162,153
Percent of total premium: 2.66%
Surplus lines premium 2023: $449,341,935
Percent change 2023 to 2024: 13.1%
Date approved: 07/28/1995
Location: Delaware
CEO: Lou Levinson
Parent company: Markel Group inc.
Parent company surplus lines premium: $588,777,053
Parent company percent of total premium: 3.08%
Surplus lines premium 2024: $415,511,737
Percent of total premium: 2.17%
Surplus lines premium 2023: $367,506,790
Percent change 2023 to 2024: 13.1%
Date approved: 08/11/1995
Location: Illinois
CEO: Simon Wilson (Markel Insurance)
Parent company: SOMPO Holdings inc.
Parent company surplus lines premium: $351,732,860
Parent company percent of total premium: 1.84%
Surplus lines premium 2024: $321,736,043
Percent of total premium: 1.68%
Surplus lines premium 2023: $312,488,628
Percent change 2023 to 2024: 3.0%
Date approved: 02/23/1996
Location: Delaware
CEO: Douglas Worman
Parent company: Berkshire Hathaway
Parent company surplus lines premium: $1,184,720,676
Parent company percent of total premium: 6.2%
Surplus lines premium 2024: $287,794,680
Percent of surplus lines business: 1.51%
Surplus lines premium 2023: $282,803,814
Percent change 2023 to 2024: 1.8%
Date approved: 09/30/2003
Location: New Hampshire
CEO: Phillip McCrorie (RSUI Group)
Parent company: Chubb Limited
Parent company surplus lines premium: $562,566,366
Parent company percent of total premium: 2.94%
Surplus lines premium 2024: $276,652,020
Percent of surplus lines business: 1.45%
Surplus lines premium 2023: $216,131,453
Percent change 2023 to 2024: 28.0%
Date approved: 06/30/1995
Location: Georgia
Division President: David Lupica
Parent company: AXA S.A.
Parent company surplus lines premium: $299,555,527
Parent company percent of total premium: 1.57%
Surplus lines premium 2024: $264,889,085
Percent of total premium: 1.39%
Surplus lines premium 2023: $225,875,274
Percent change 2023 to 2024: 17.3%
Date approved: 12/08/1995
Location: Delaware
CEO: Scott Gunter (AXA XL)
Parent company: Starr International Company Inc.
Parent company surplus lines premium: $236,682,853
Parent company percent of total premium: 1.24%
Surplus lines premium 2024: $236,682,853
Percent of surplus lines business: 1.24%
Surplus lines premium 2023: $277,144,060
Percent change 2023 to 2024: -14.6%
Date approved: 11/16/2010
Location: Texas
CEO: Steve Blakey
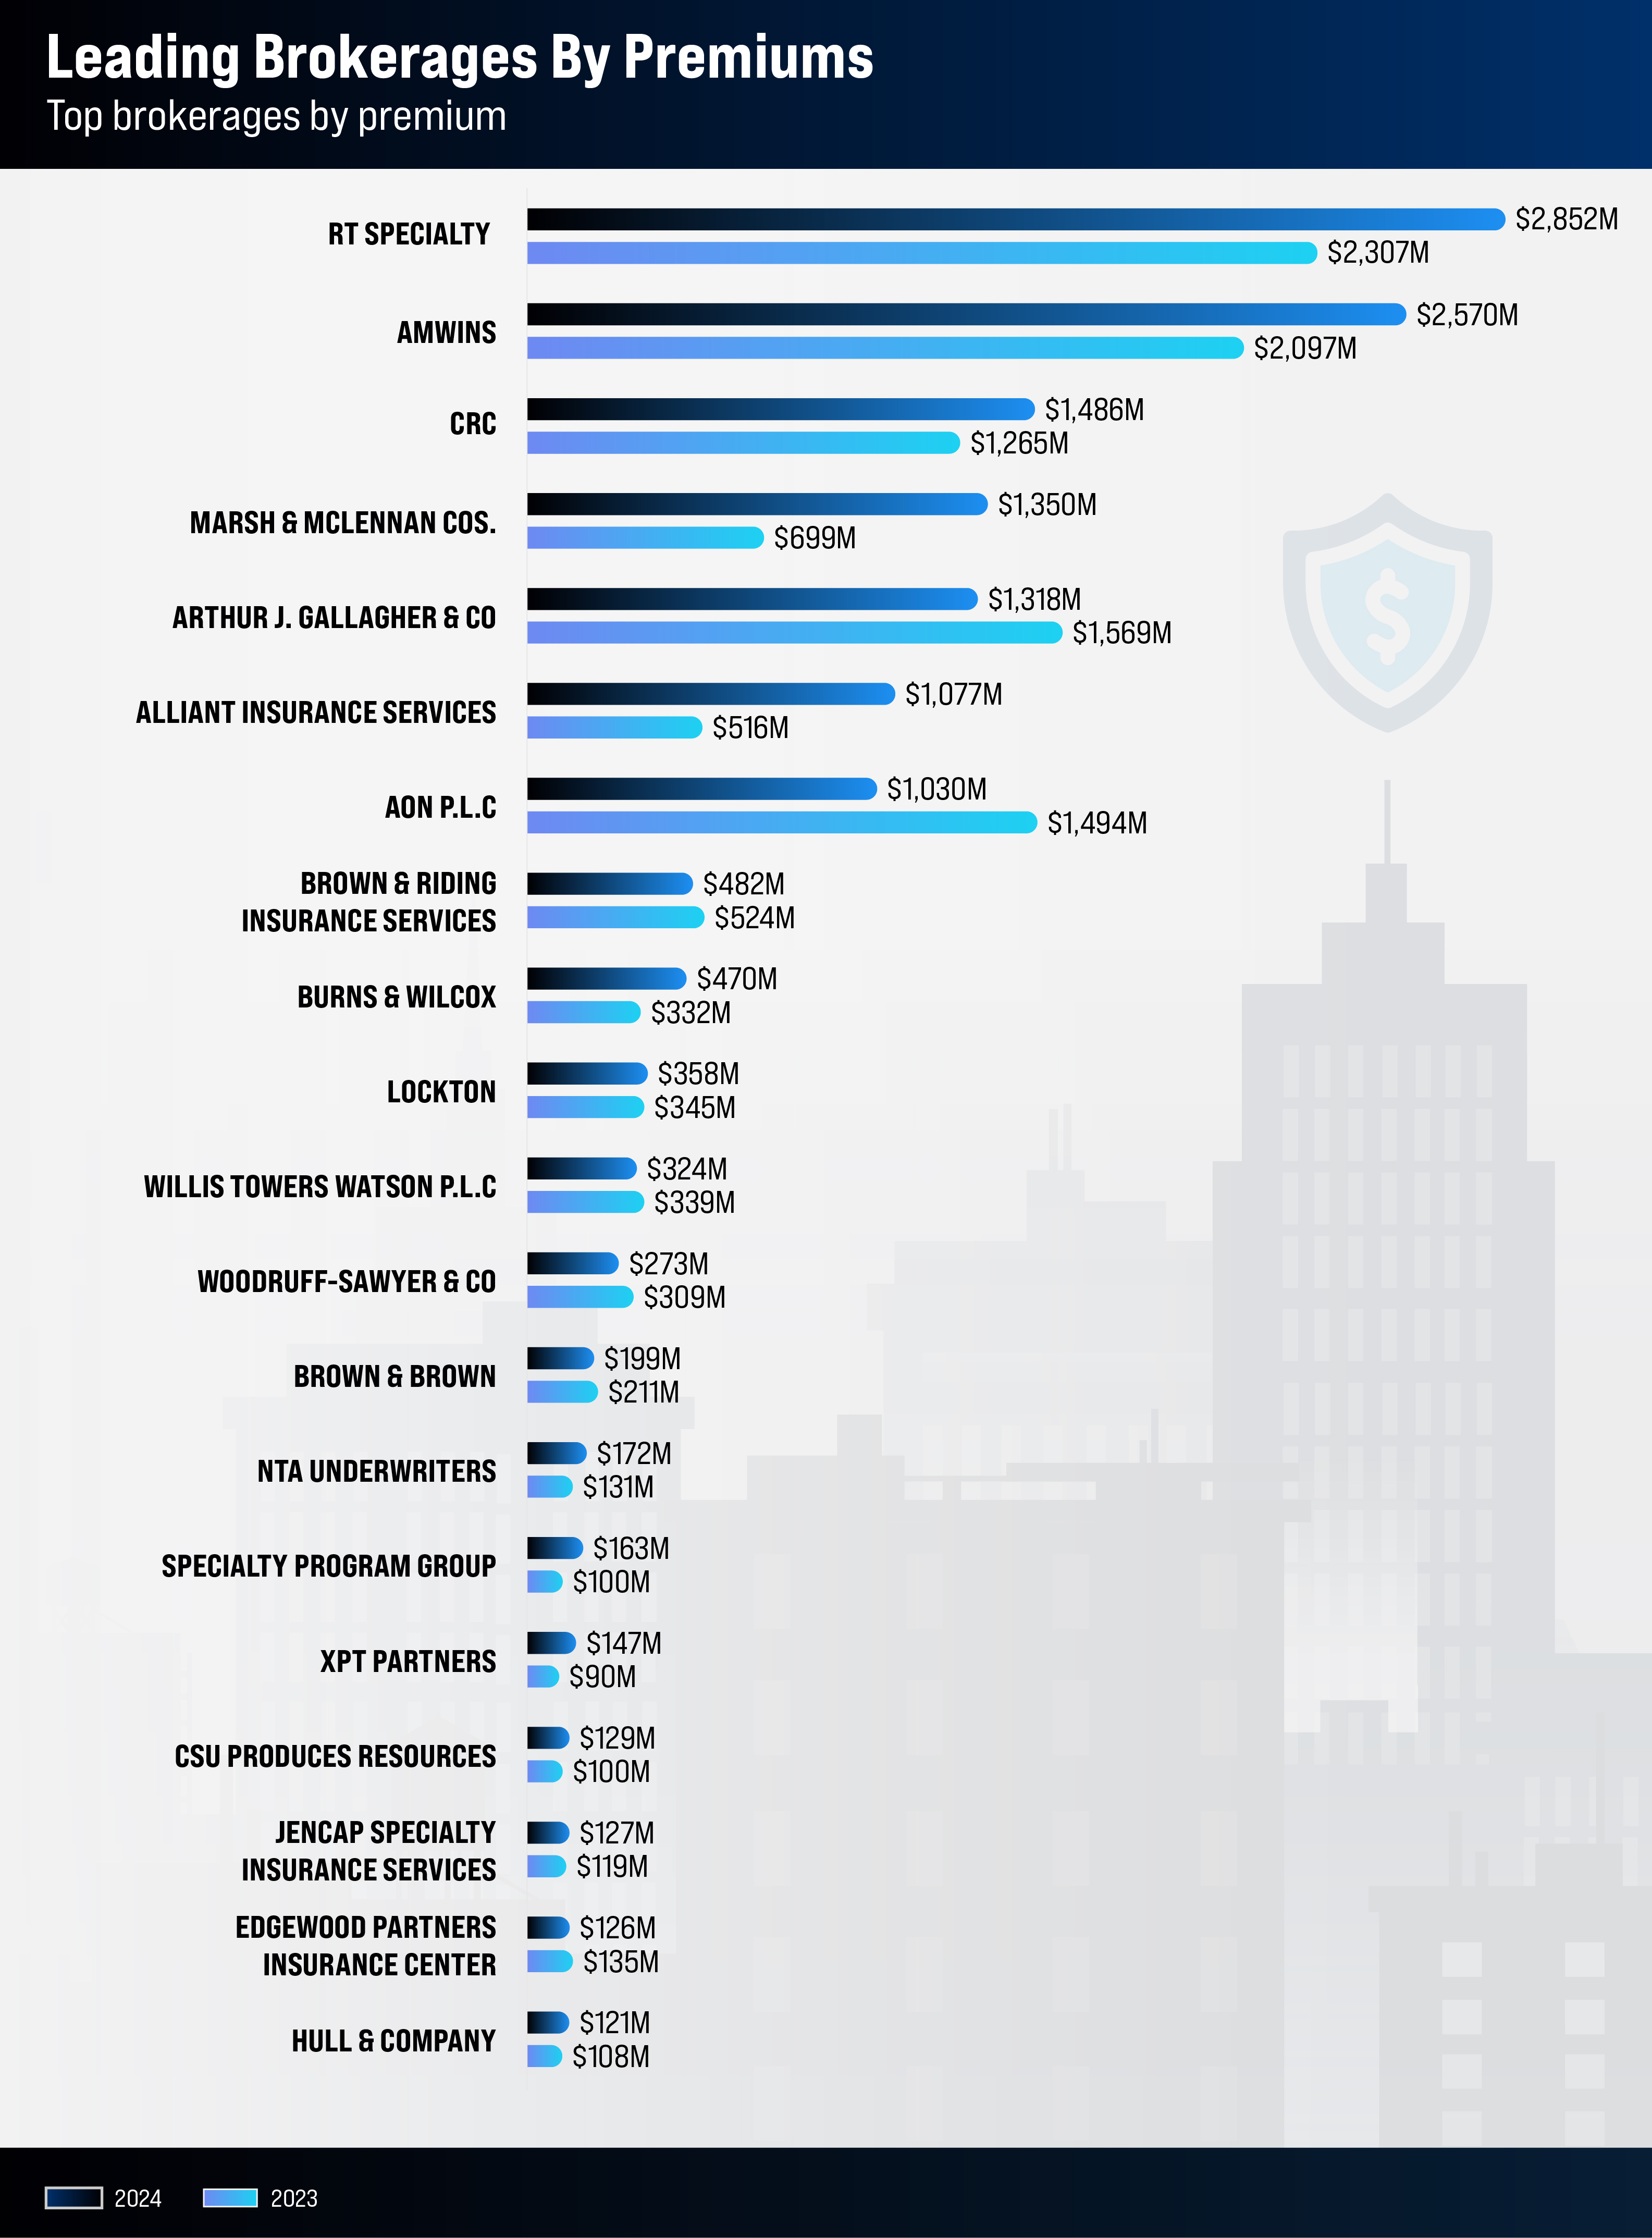
RT Specialty leads California’s brokerage market with the highest surplus lines premium at $2,851,293,553. Amwins ranks second, with a total premium of $2,569,228,035 and the highest number of transactions at 125,439. Of the top 20 brokers, 13 saw an increase in premiums compared to the previous year, while Arthur J. Gallagher and Aon experienced the most notable declines.
Adapting to this evolving market has required creativity in policy structuring, especially with high-limit policies. The trend is shifting toward layering smaller policies to spread risk, with insurers pushing for higher premiums on these smaller limits.
"A $25 million policy that used to cost $100,000 now requires three carriers and costs $200,000," says Kris Bauer, president of the western region at Jencap Specialty Insurance Services, which has seen an 8.6% premium increase year-over-year.
This shift has fueled significant growth within the surplus lines market. Jencap and similar insurers are stepping up to offer flexible but higher-cost solutions, particularly in high-risk sectors like property and auto, where traditional insurers may be unwilling to enter.
“It’s certainly becoming a major component of insurance in general,” says Bauer, who also serves as a board member of the Surplus Lines Association of California (SLA). “The E&S sector has always been able to create creative solutions by drilling down on the individual risk.”
As traditional insurers withdraw from high-risk areas, surplus lines carriers are stepping in. These insurers are no longer just filling gaps—they’re adapting to new realities, offering coverage on their own terms and at higher prices.
“If the standard and admitted markets can’t do it, the surplus lines industry adapts,” Bauer explains. “They’re not saying no, but they’re writing it under their terms and at their price.”
In recent years, submission flow into the surplus lines market has surged, driven by growing demand for alternative insurance options. This increase signals the expanding role of surplus lines insurers like Jencap, who are stepping in to fill critical gaps left by traditional insurers.
“The submission flow in most of these carriers has tripled in the last three to five years,” Bauer says.
Bauer also suggests that this shift is part of a larger, systemic change in the insurance market—one that extends beyond California’s borders. The days of pre-2019 coverage limits are unlikely to return, especially for high-risk sectors.
For Jencap, the goal is clear: adapt to the evolving market, meet the demand where traditional insurers won’t and continue providing innovative solutions to serve California’s most vulnerable sectors.
“This is the market we’ll be dealing with for the foreseeable future,” Bauer says.
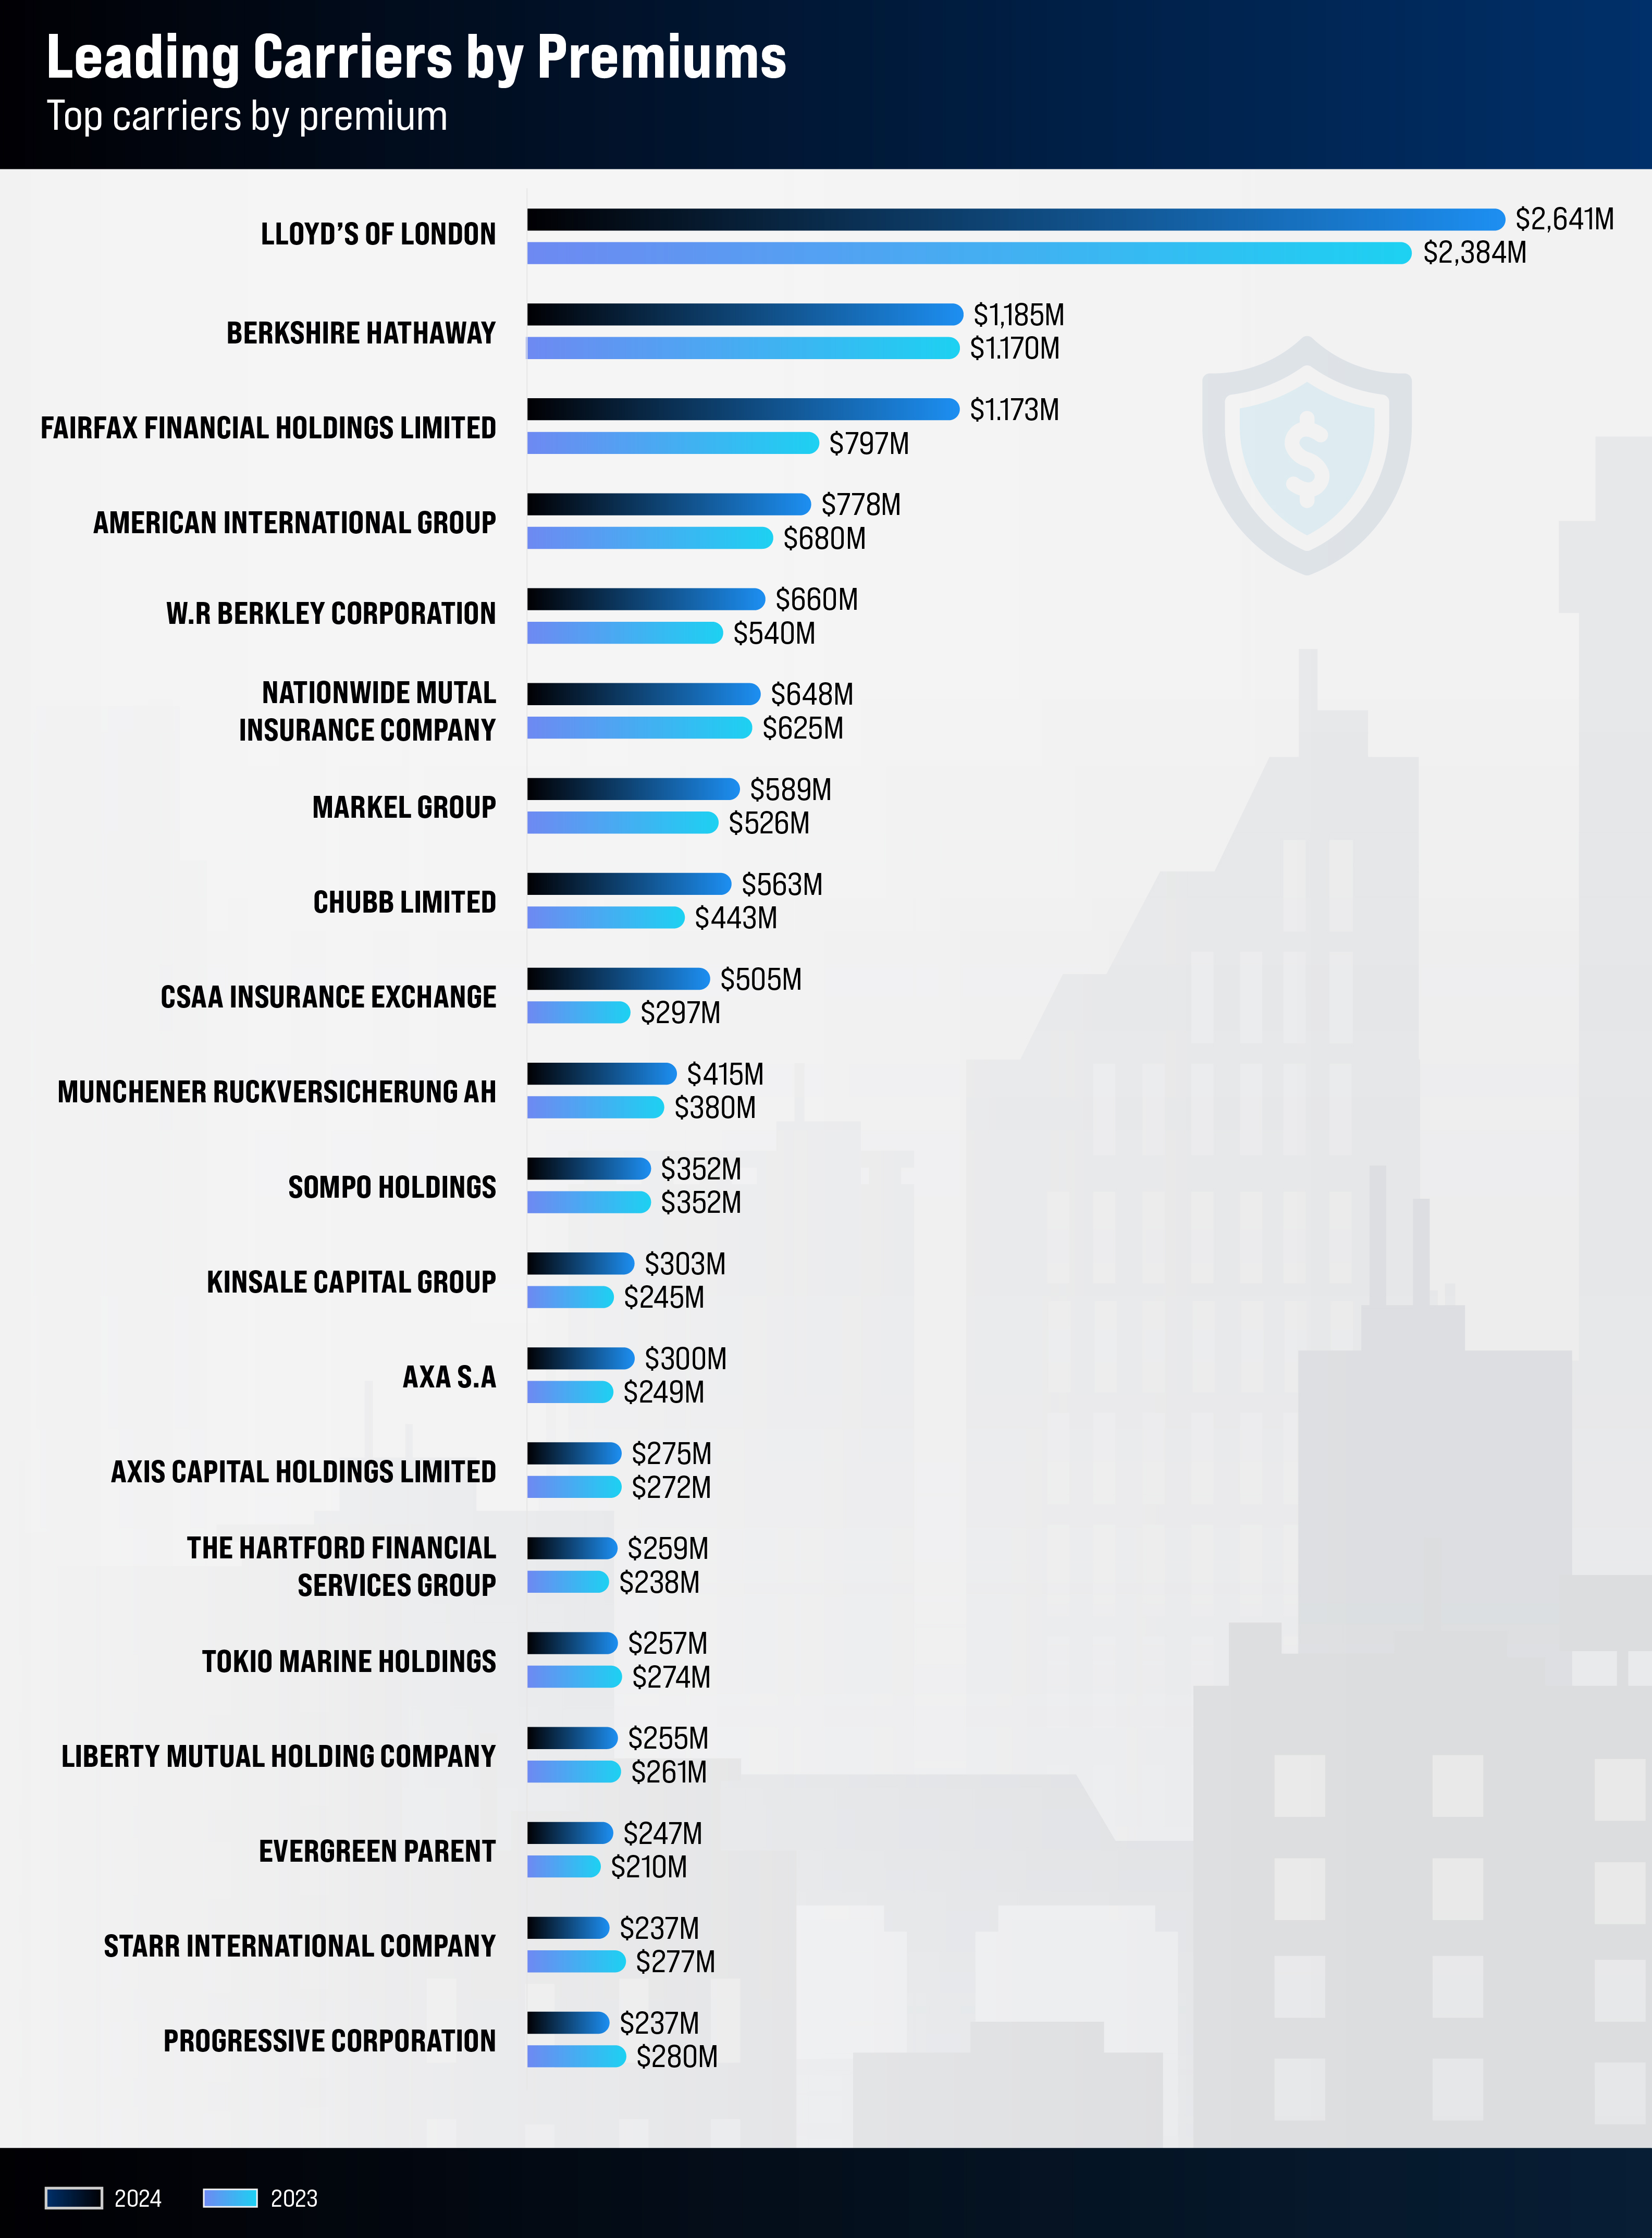
Among the top 20 leading carriers, 16 saw premium increases in 2024, with LLOYD’s maintaining its dominant position, leading both 2023 and 2024.
LLOYD’s stronghold in the surplus lines market is largely driven by international and domestic insurers entering the U.S. market to cover hard-to-protect homes. This follows the pullback of major U.S. firms like Allstate and State Farm, which have reduced coverage in high-risk states like Florida and California.
“When the market (terms and conditions) hardens, it has to go outside of the States, and Lloyd's is often the beneficiary,” Robert Greensted, a director at S&P Global, told Reuters. “The potential for profitability is obvious, but it also brings additional risk.”
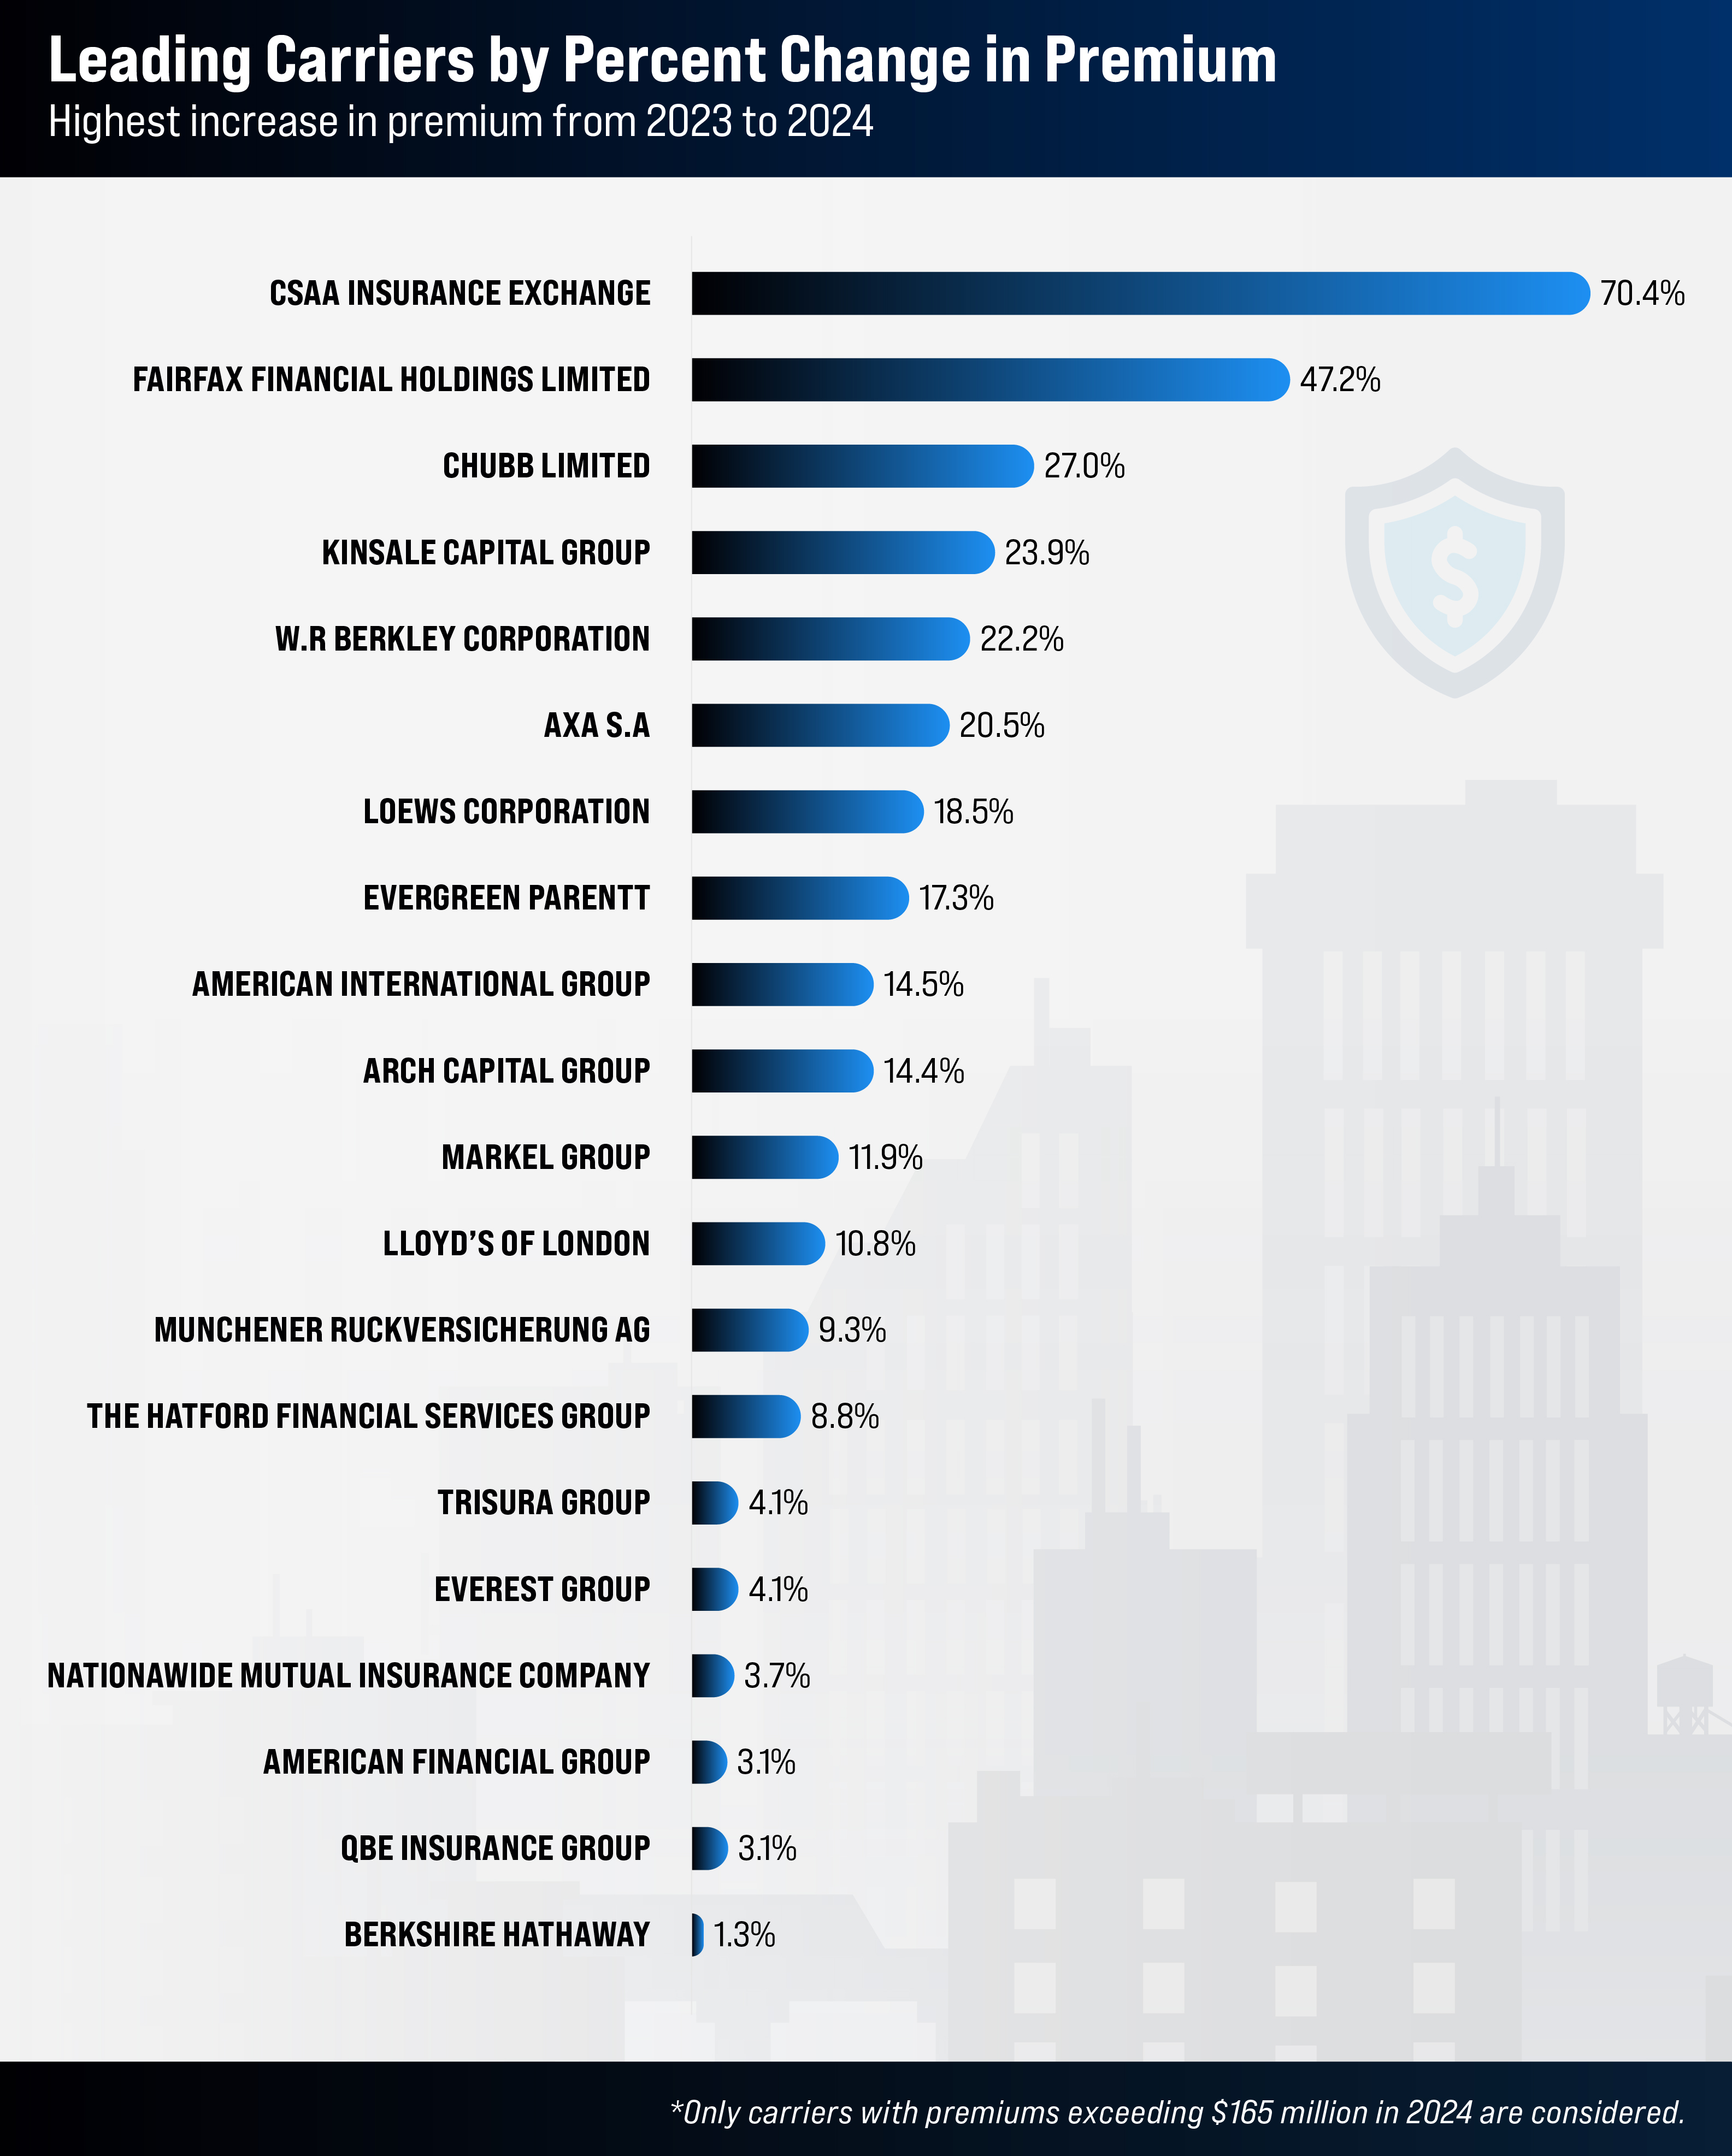
In 2024, CSAA Insurance Exchange experienced the most significant premium increase, rising by 70.4%. Several key factors contributed to this surge:
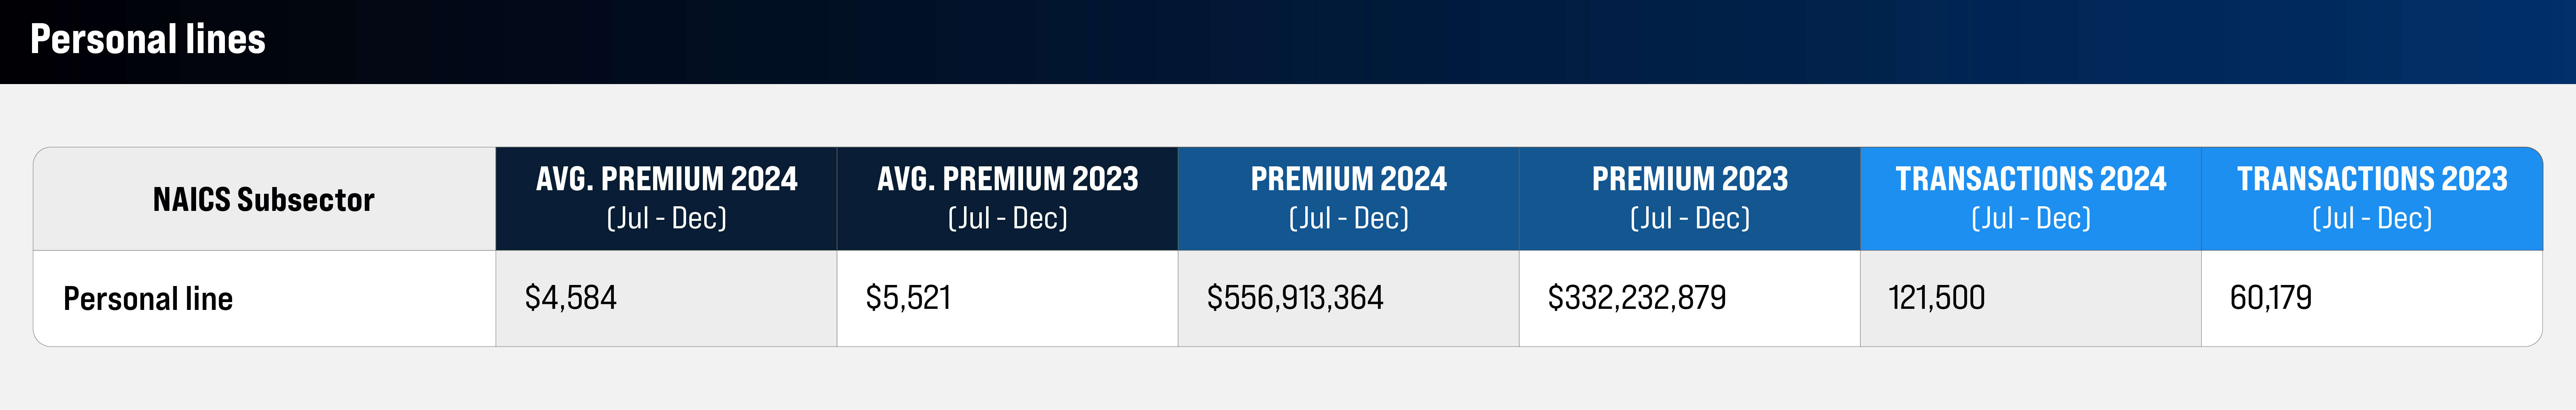
The personal lines subsector saw significant growth, with premiums rising by 67.6% and transactions increasing by 101.9%.
“We’re seeing many insurance companies with E&S paper offering E&S solutions to personal lines clients, particularly for homeowner’s and property insurance,” says Alexandra Littlejohn, EVP and Senior Managing Director at Alliant Insurance Services. “This trend has been evolving over the last year, and I expect it to continue into 2025.”
“I think we’ll see substantial progress in the surplus lines market as it advances solutions for personal lines clients, especially those in high-risk disaster zones like wildfires or earthquakes.”
In California, homeowners’ insurance was the only sector to experience a significant spike in both premiums and transactions. Other sectors saw expected responses to state-specific risks, according to Michael Caturegli, Chief Technology and Analysis Officer at the Surplus Lines Association of California.
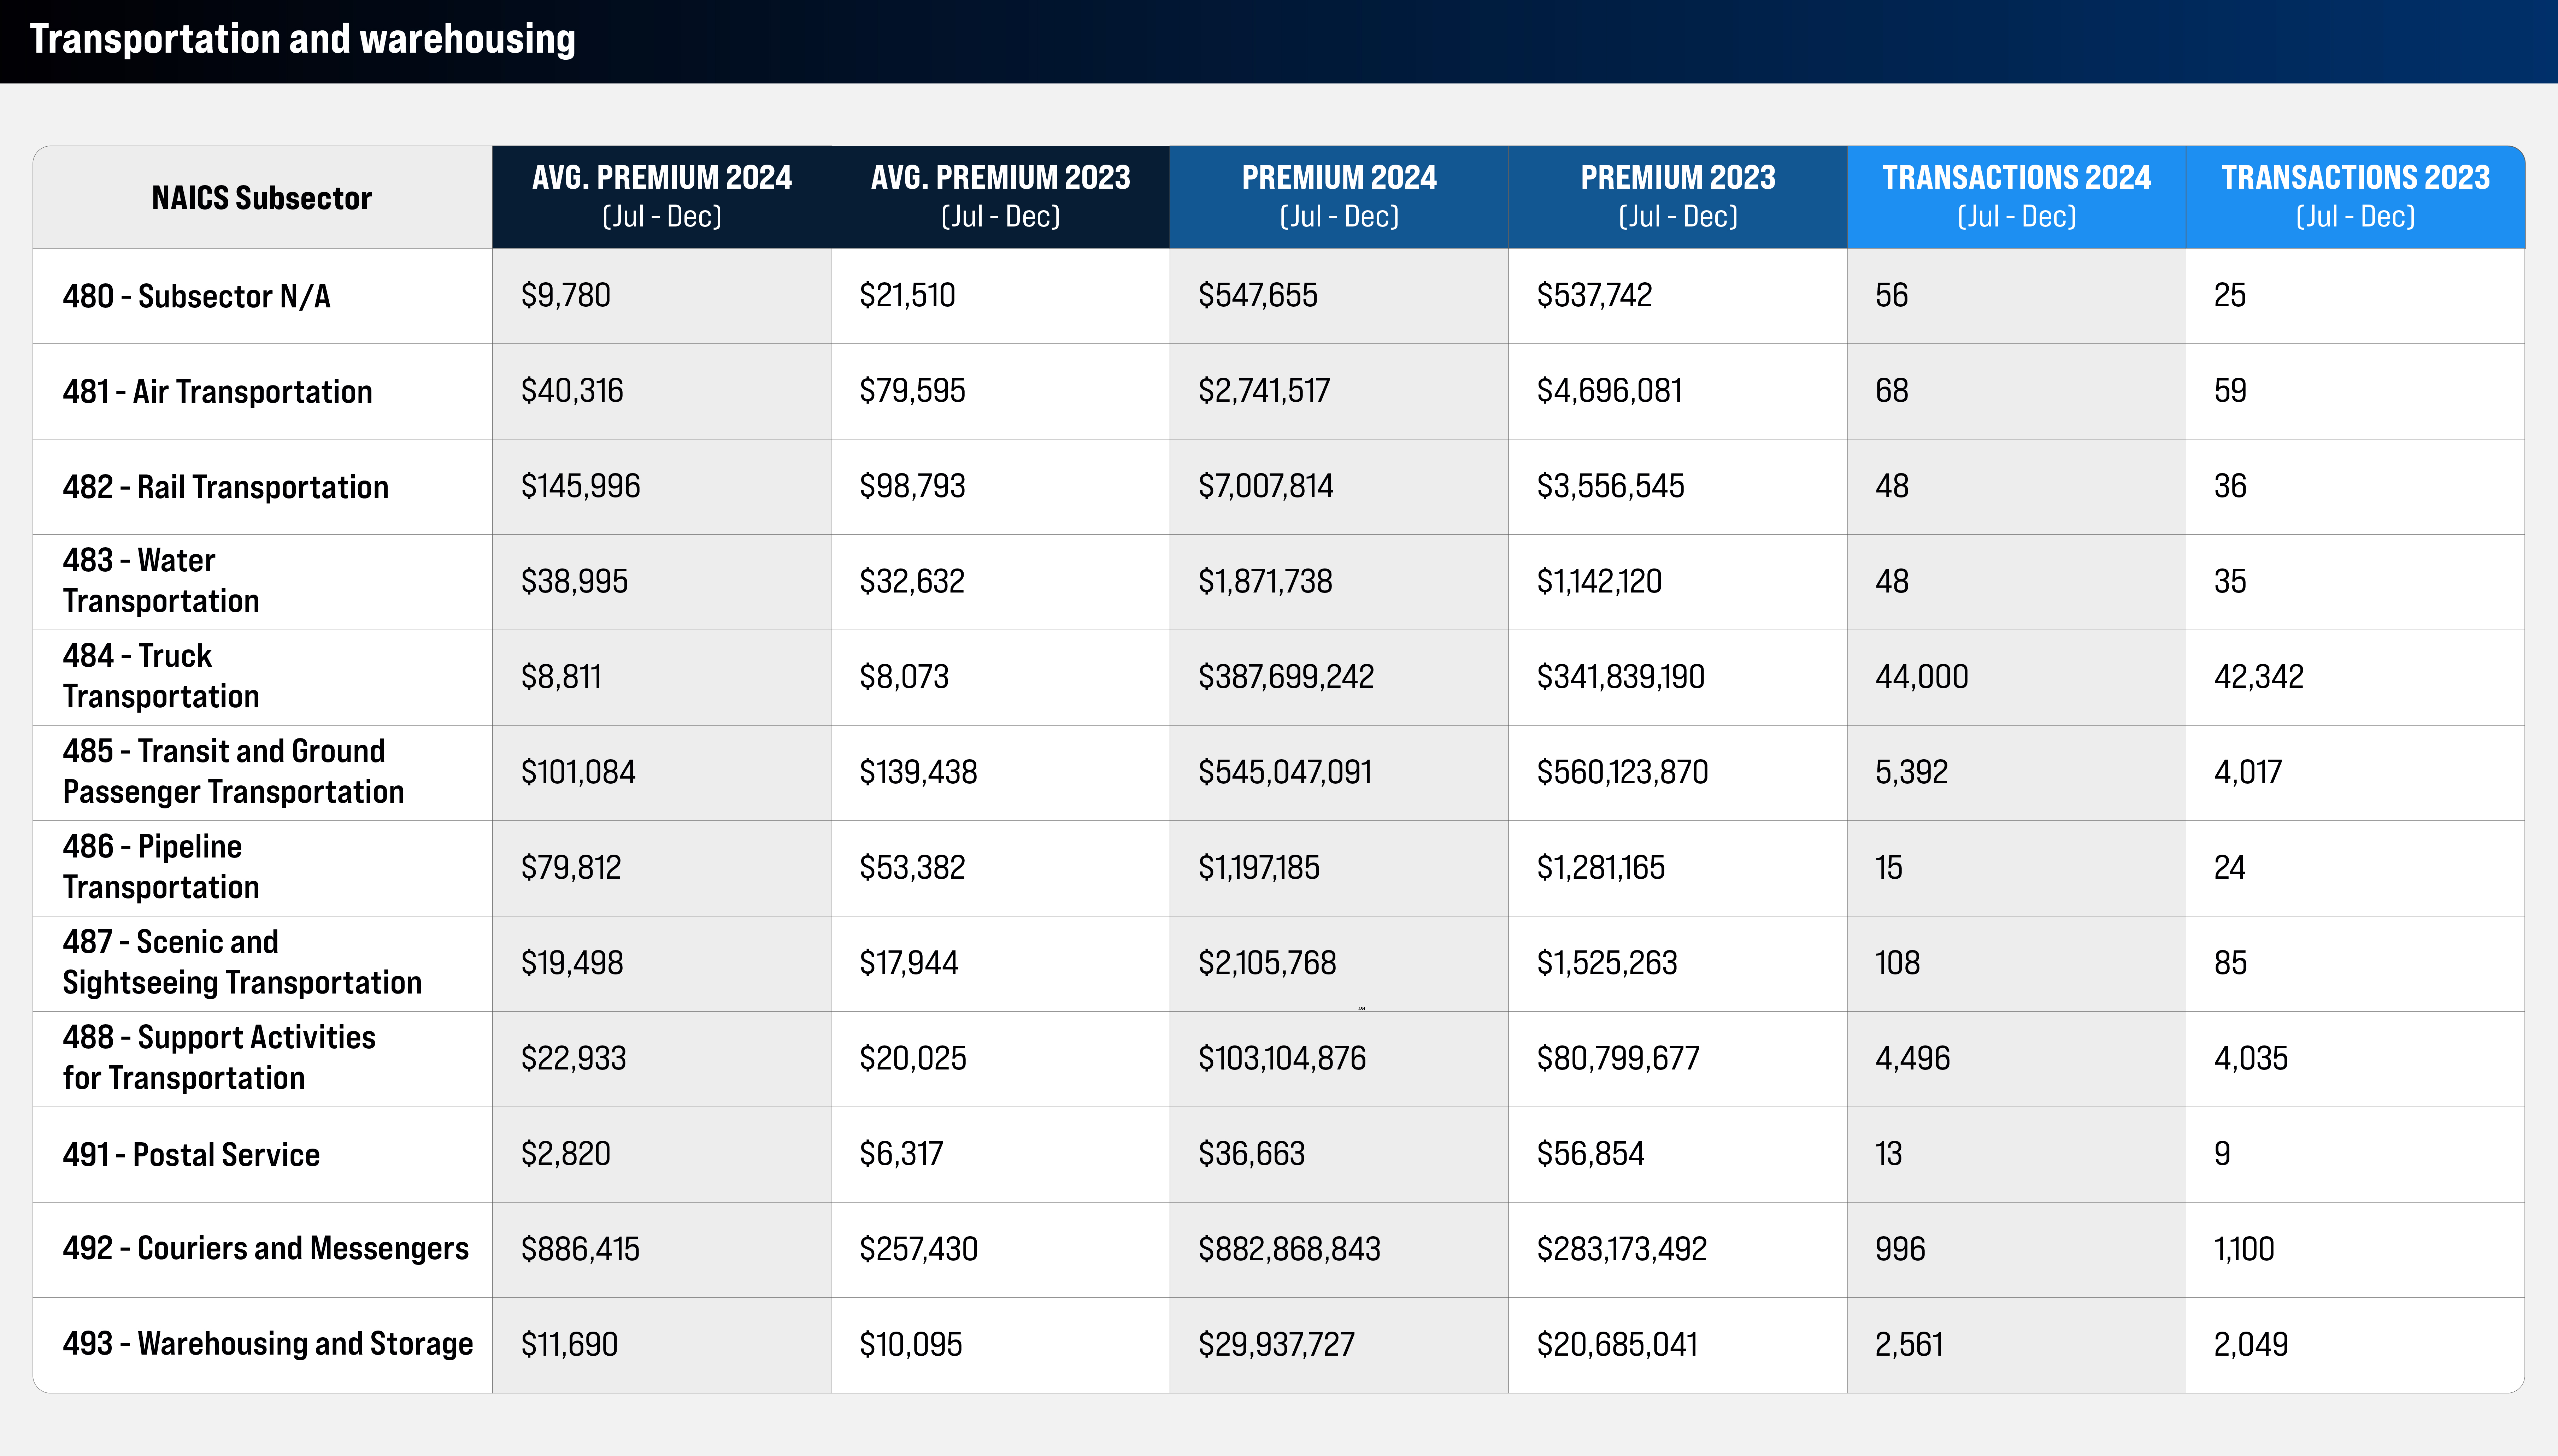
The transportation sector experienced a slight decline, partly due to reductions in municipal transportation.
“We’ve seen a drop in transportation related to buses owned by municipalities, but we’re not seeing a similar decrease in trucking or other transportation subsectors,” Caturegli notes.
This trend is evident in subsectors like transit and ground passenger transportation, which saw a 2.69% decrease in total premiums, while truck transportation premiums increased by 3.7%. Messengers and couriers saw a notable 13.4% premium increase.
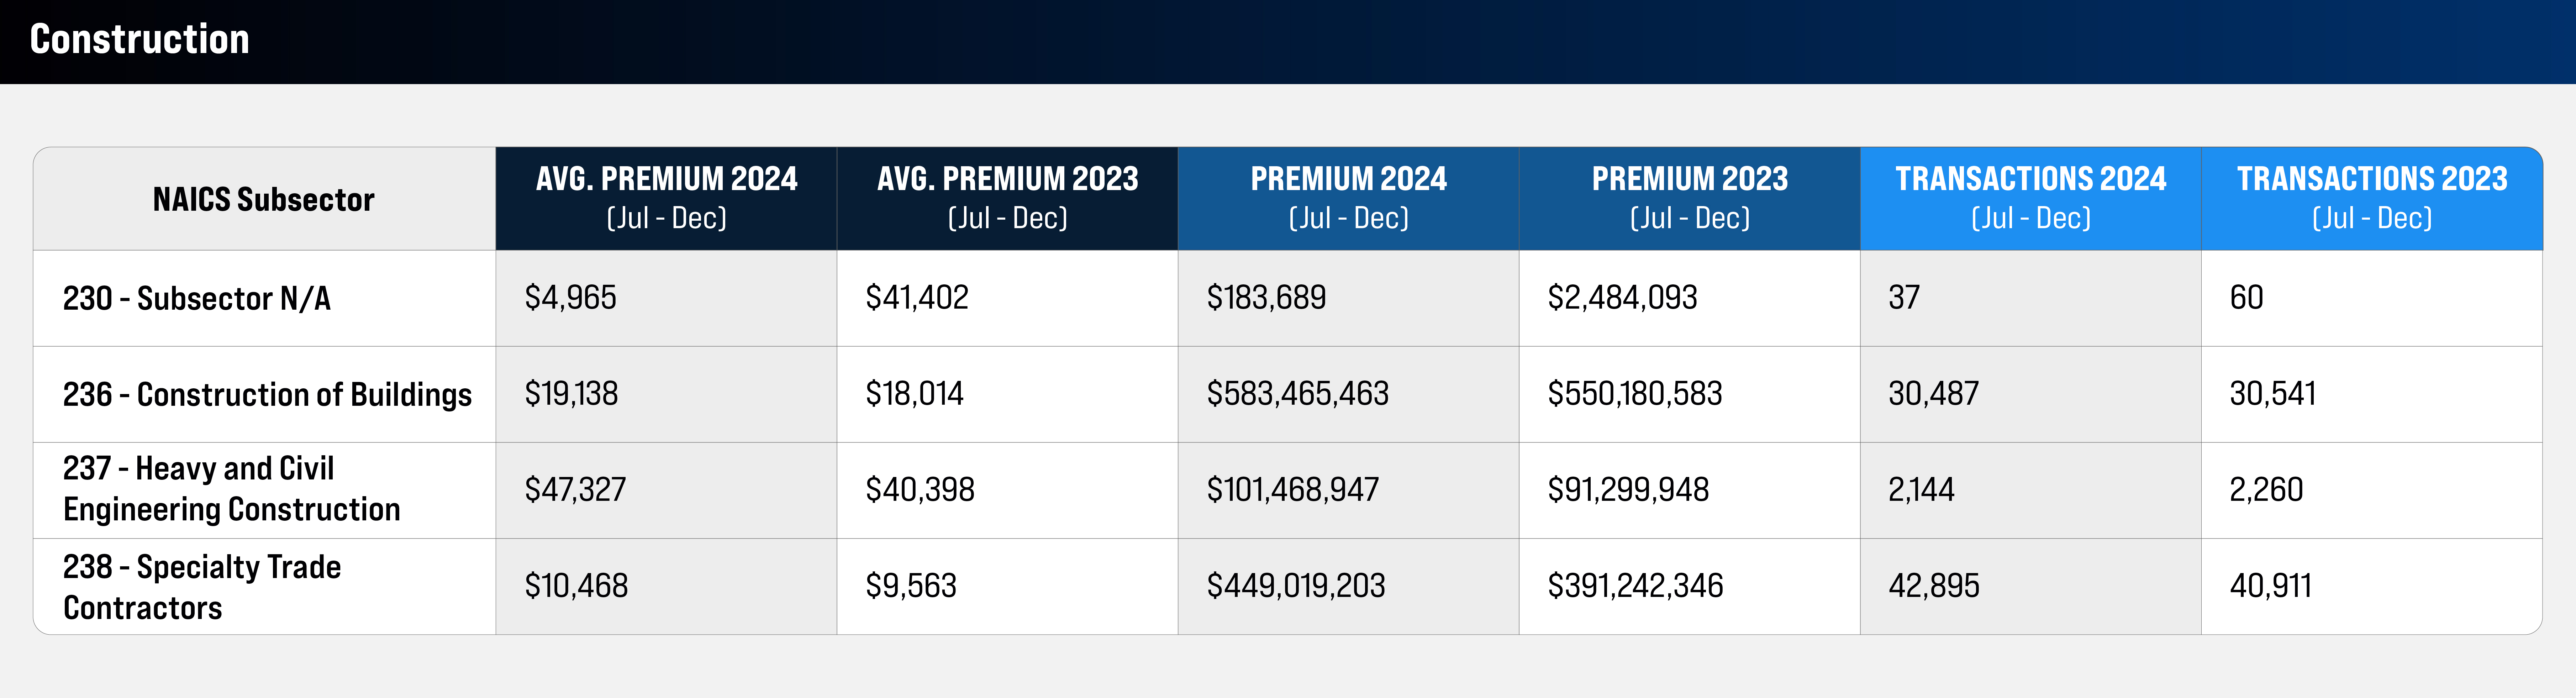
The construction sector saw gains across all specified subsectors. Heavy and civil engineering construction and specialty trade contractors experienced premium increases of 11.1% and 14.8%, respectively.
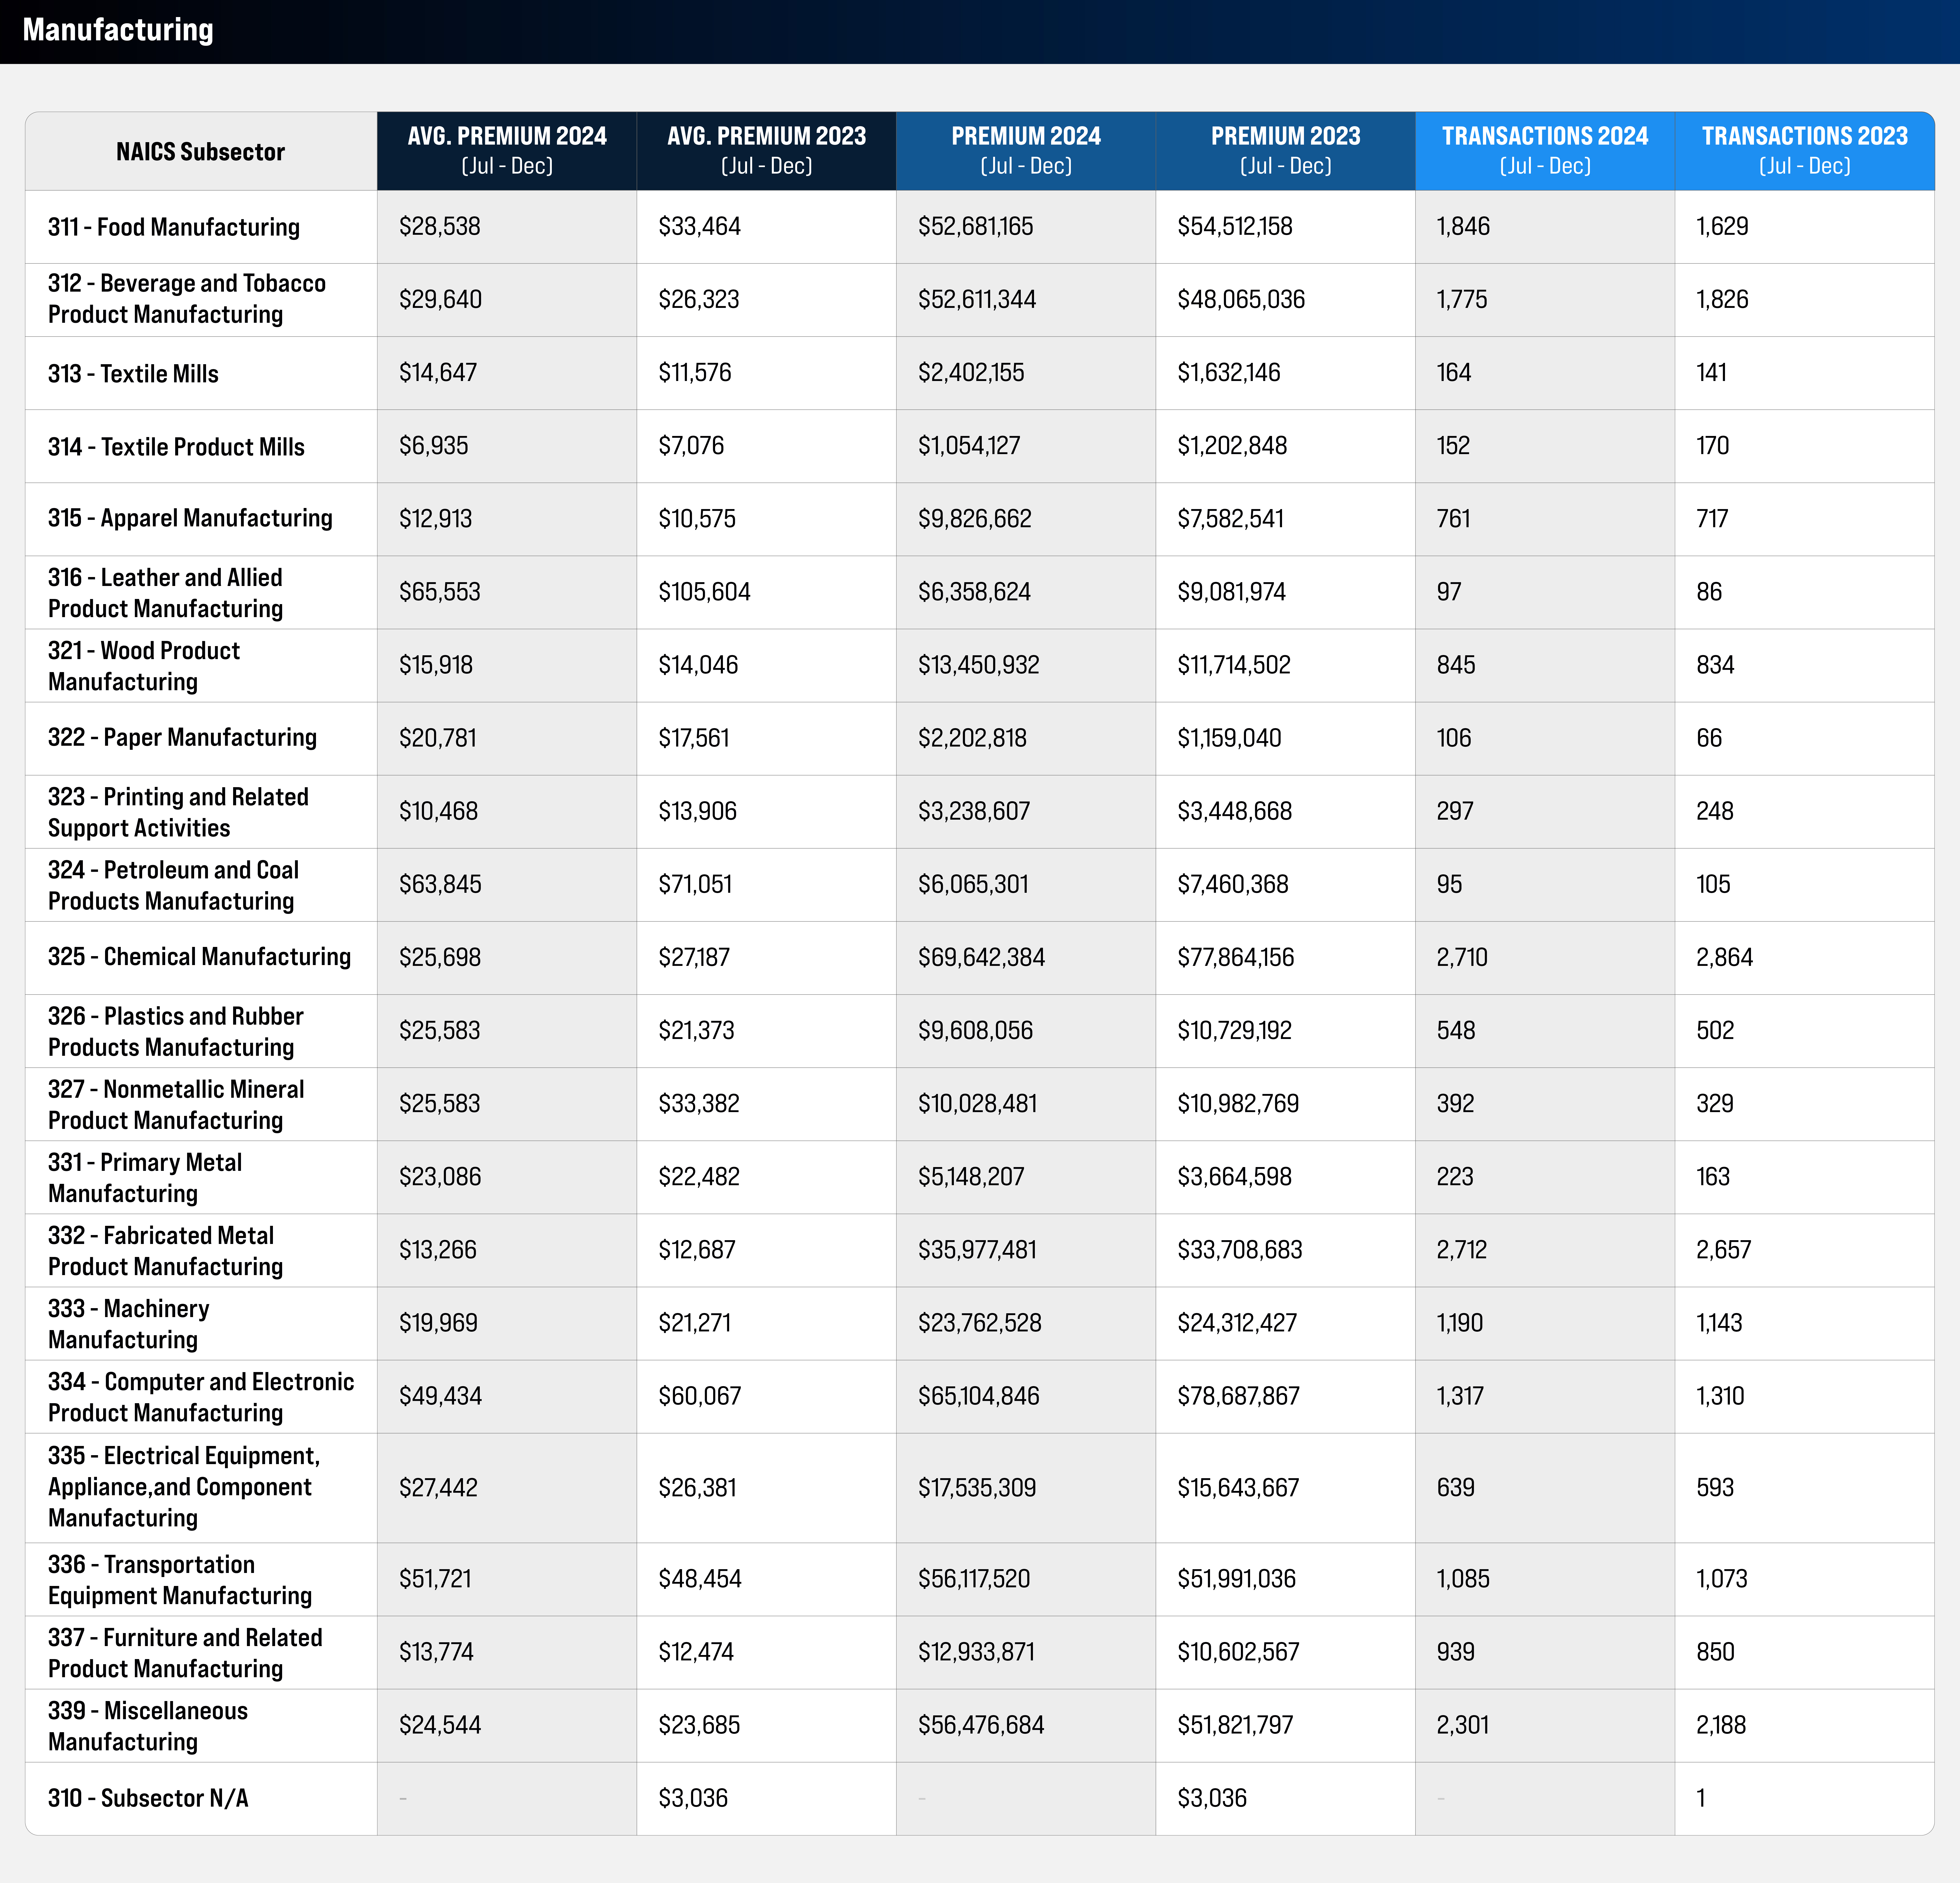
The manufacturing sector displayed mixed results. Chemical manufacturing and computer and electronic product manufacturing saw significant premium increases, while food manufacturing and leather and allied product manufacturing experienced declines. Textile product mills, printing and related support activities and nonmetallic mineral product manufacturing showed slight fluctuations but ultimately demonstrated stability in total premiums from 2023 to 2024.
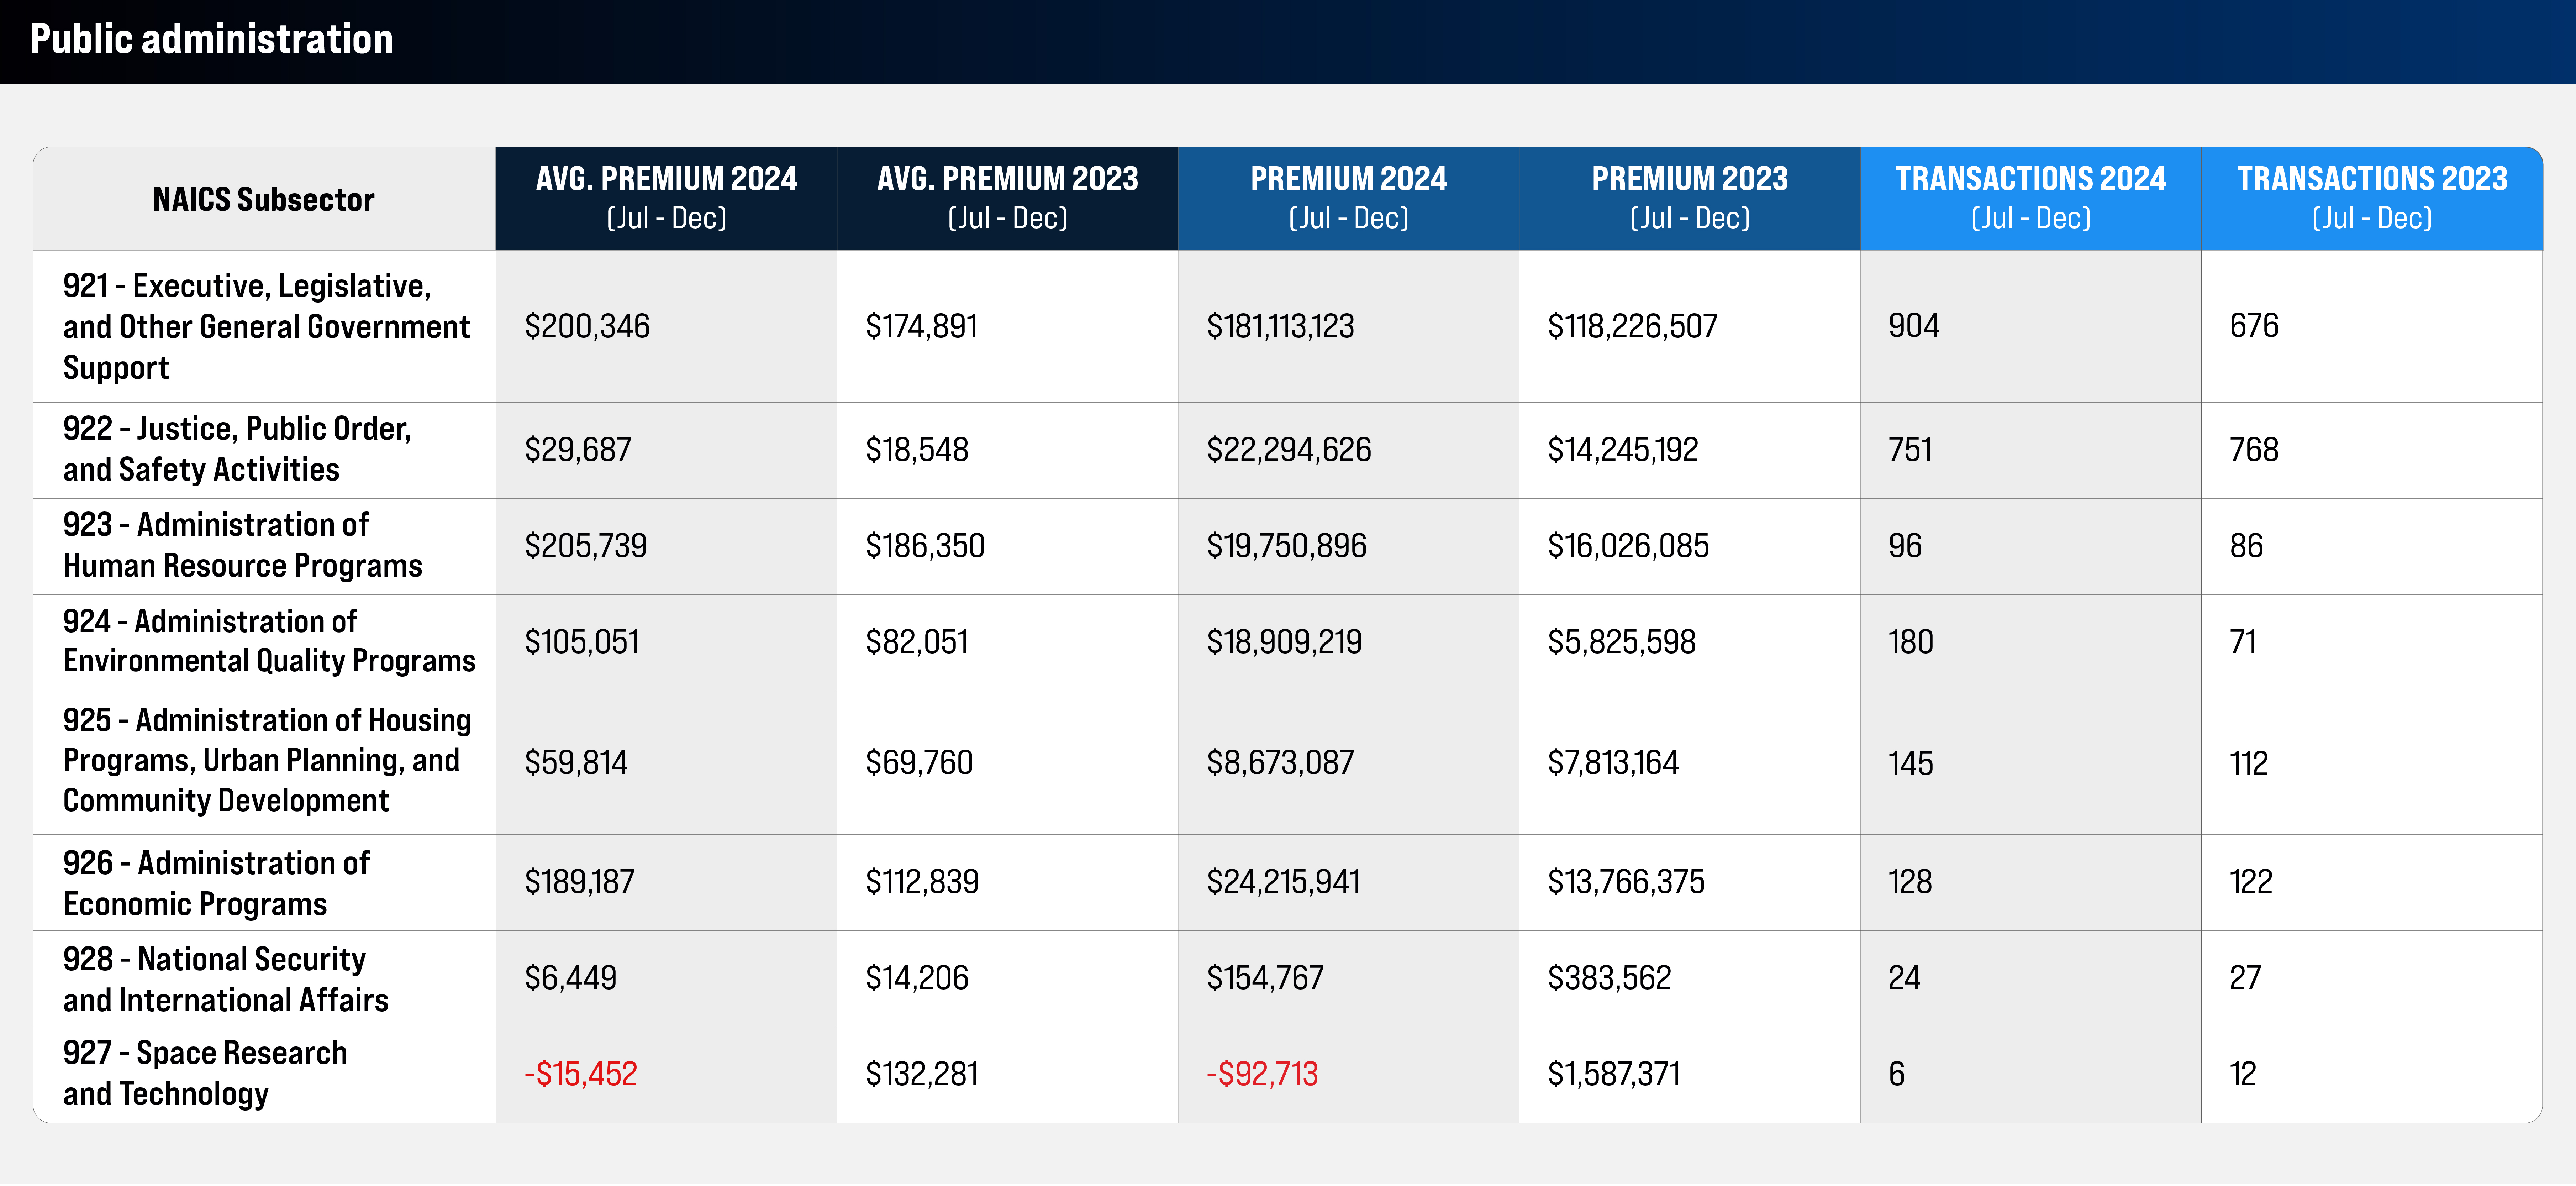
The public administration sector experienced substantial growth, with several subsectors seeing premium increases of over 50%. Notably, the administration of environmental quality programs saw a remarkable 224.6% increase in total premiums. On the other hand, the national security and international affairs and space research and technology subsectors experienced significant declines in premiums, with decreases of 59.7% and 105.8%, respectively.
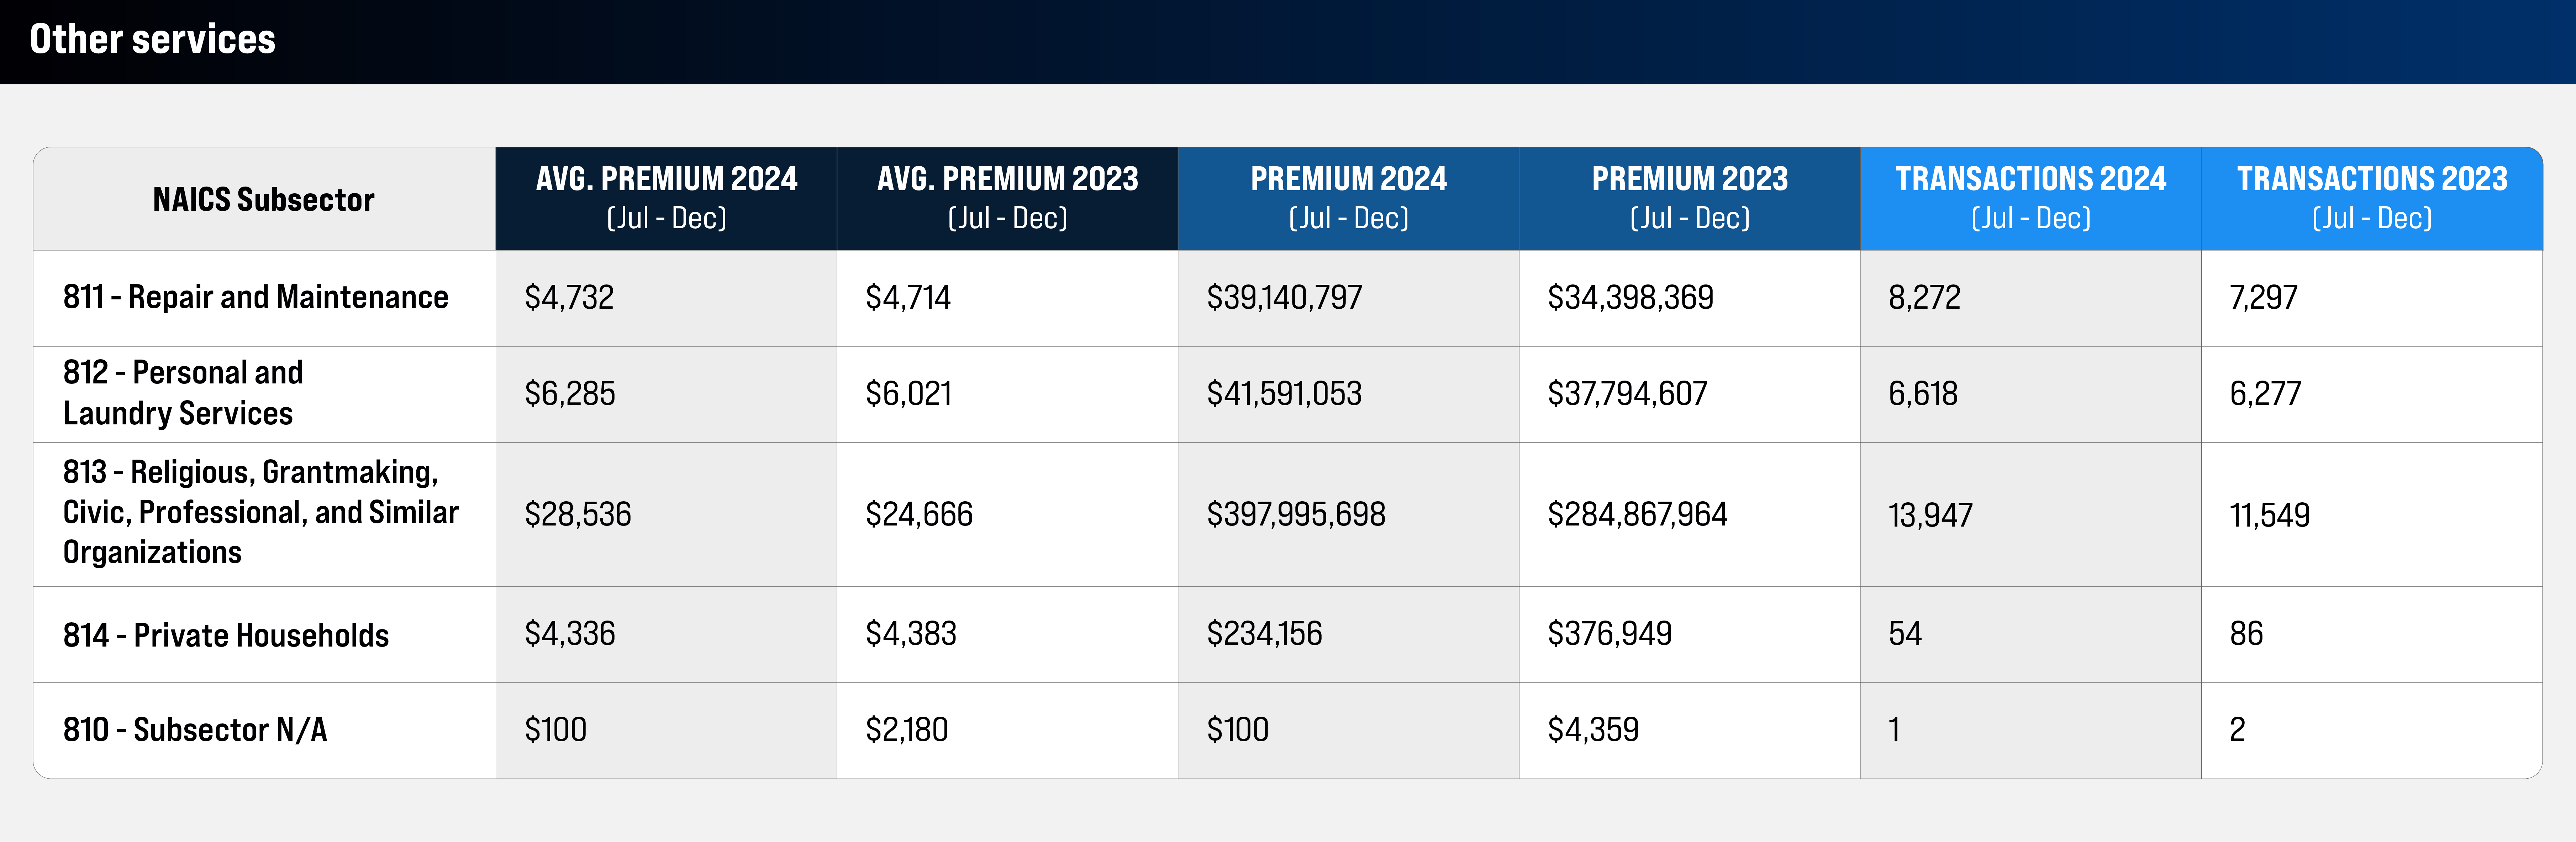
The other services sector saw a general increase in premiums across all specified subsectors, with the exception of private households, which experienced a 37.9% decrease.
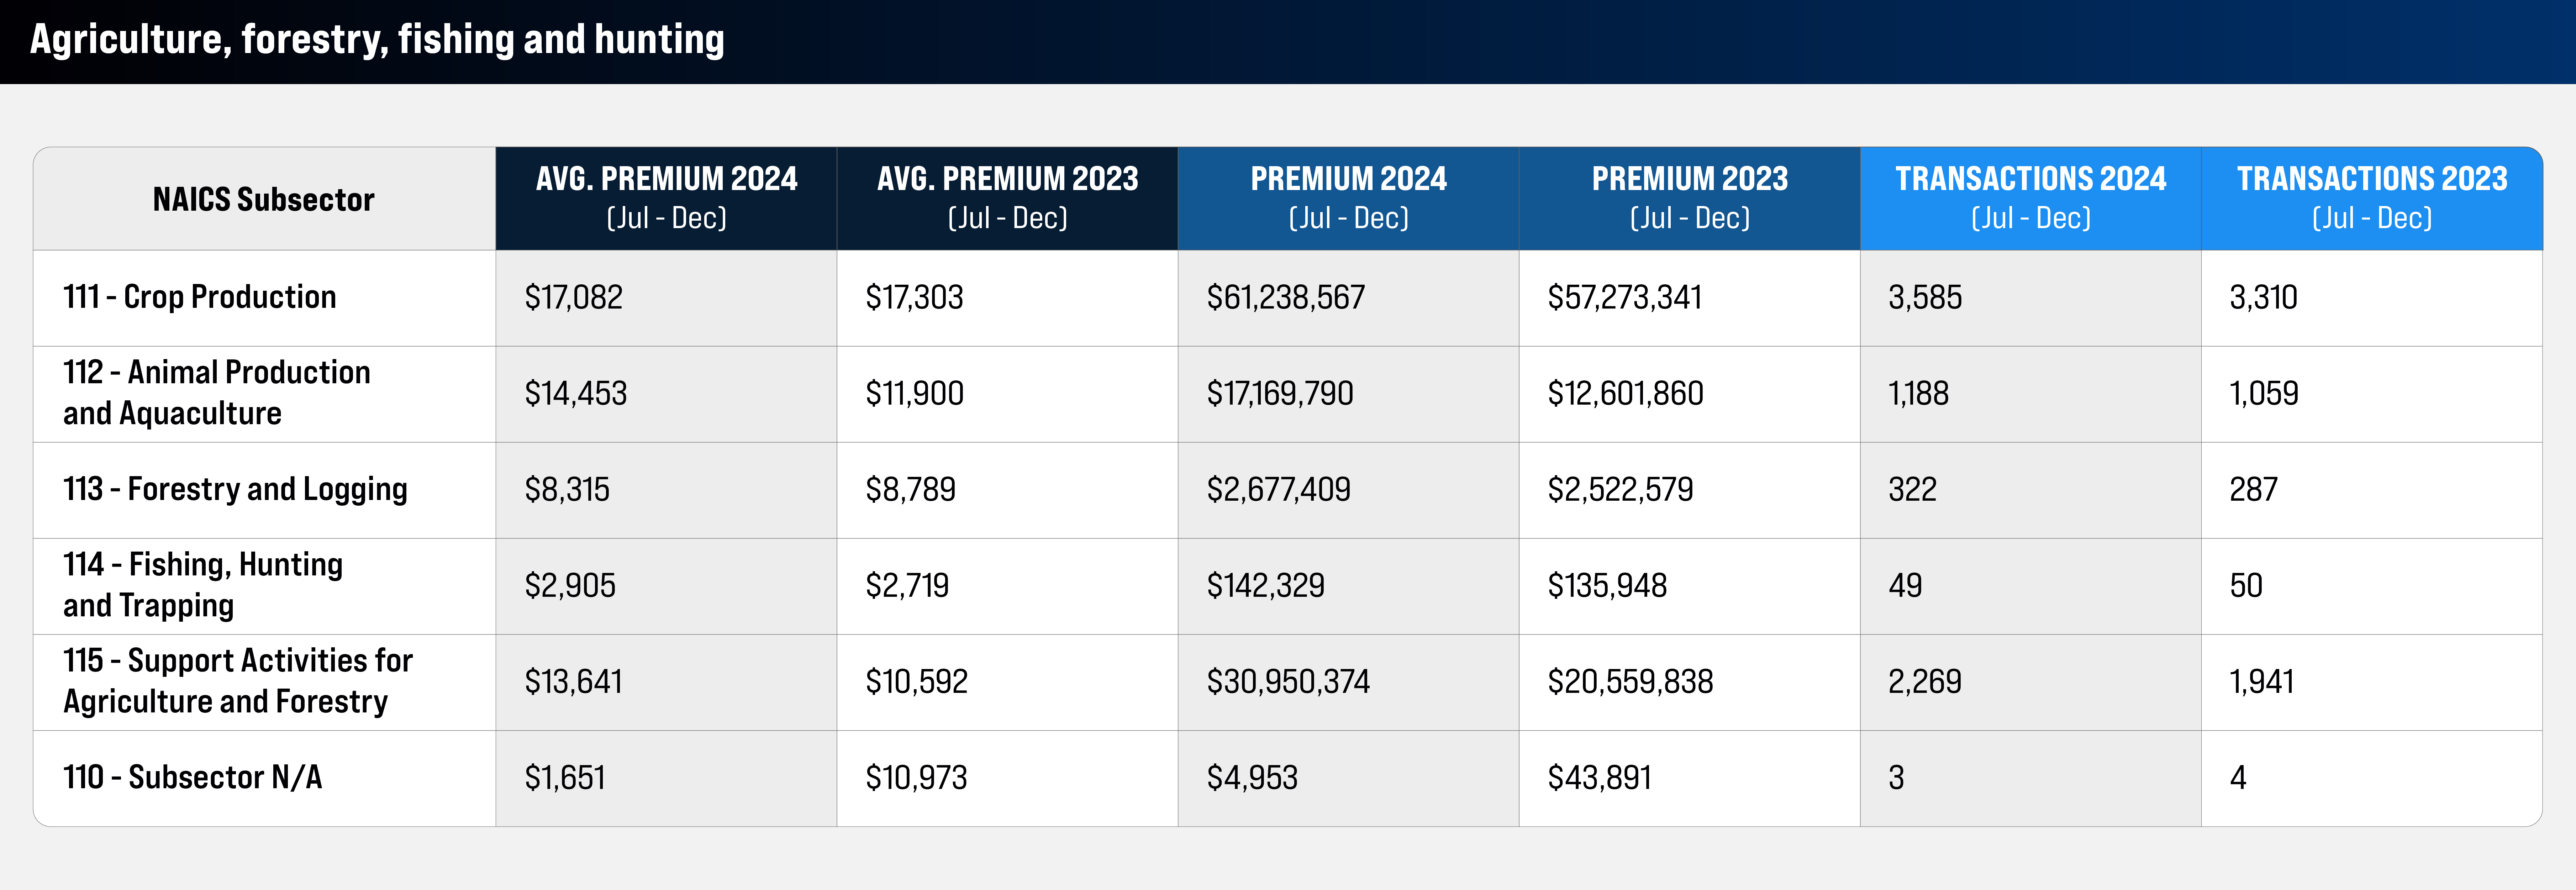
In the agriculture, forestry, fishing and hunting sector, support activities for agriculture and forestry saw the largest premium increase at 50.5%, while fishing, hunting and trapping experienced a more modest rise of 4.7%.
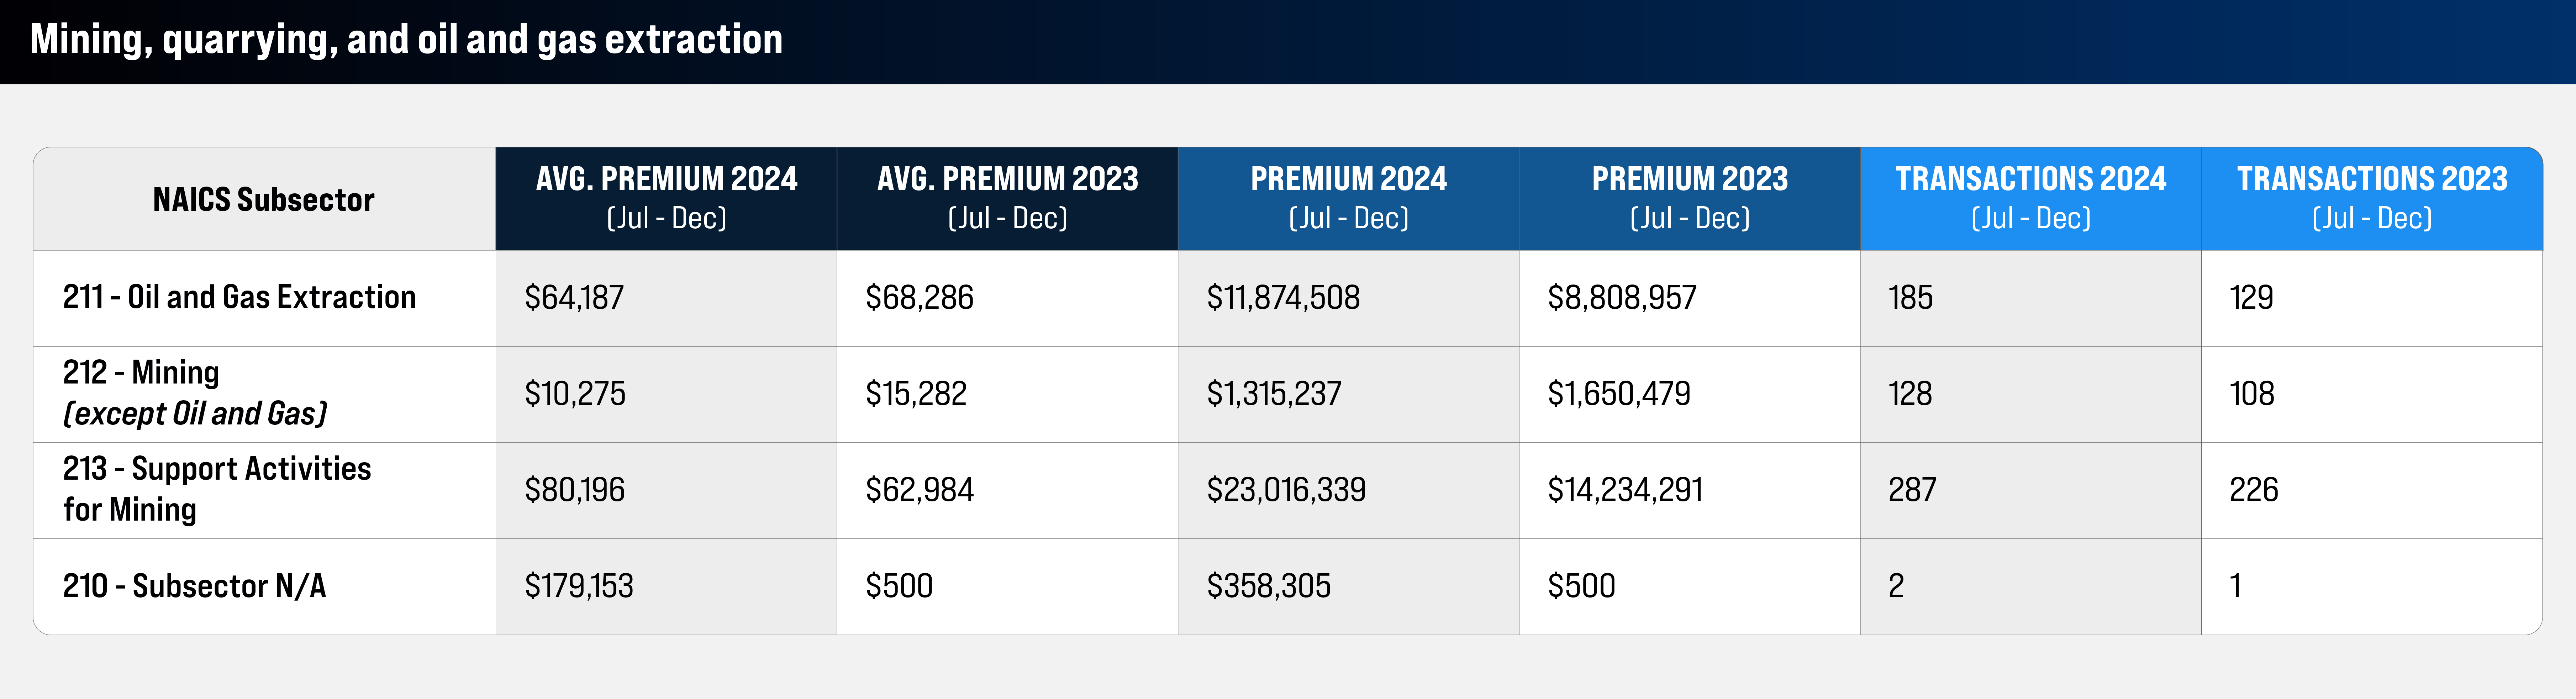
The mining, quarrying and oil and gas extraction sector saw overall premium and transaction increases across all subsectors, with the exception of mining. While transactions in the mining subsector increased, total premium dropped by 20.3%.
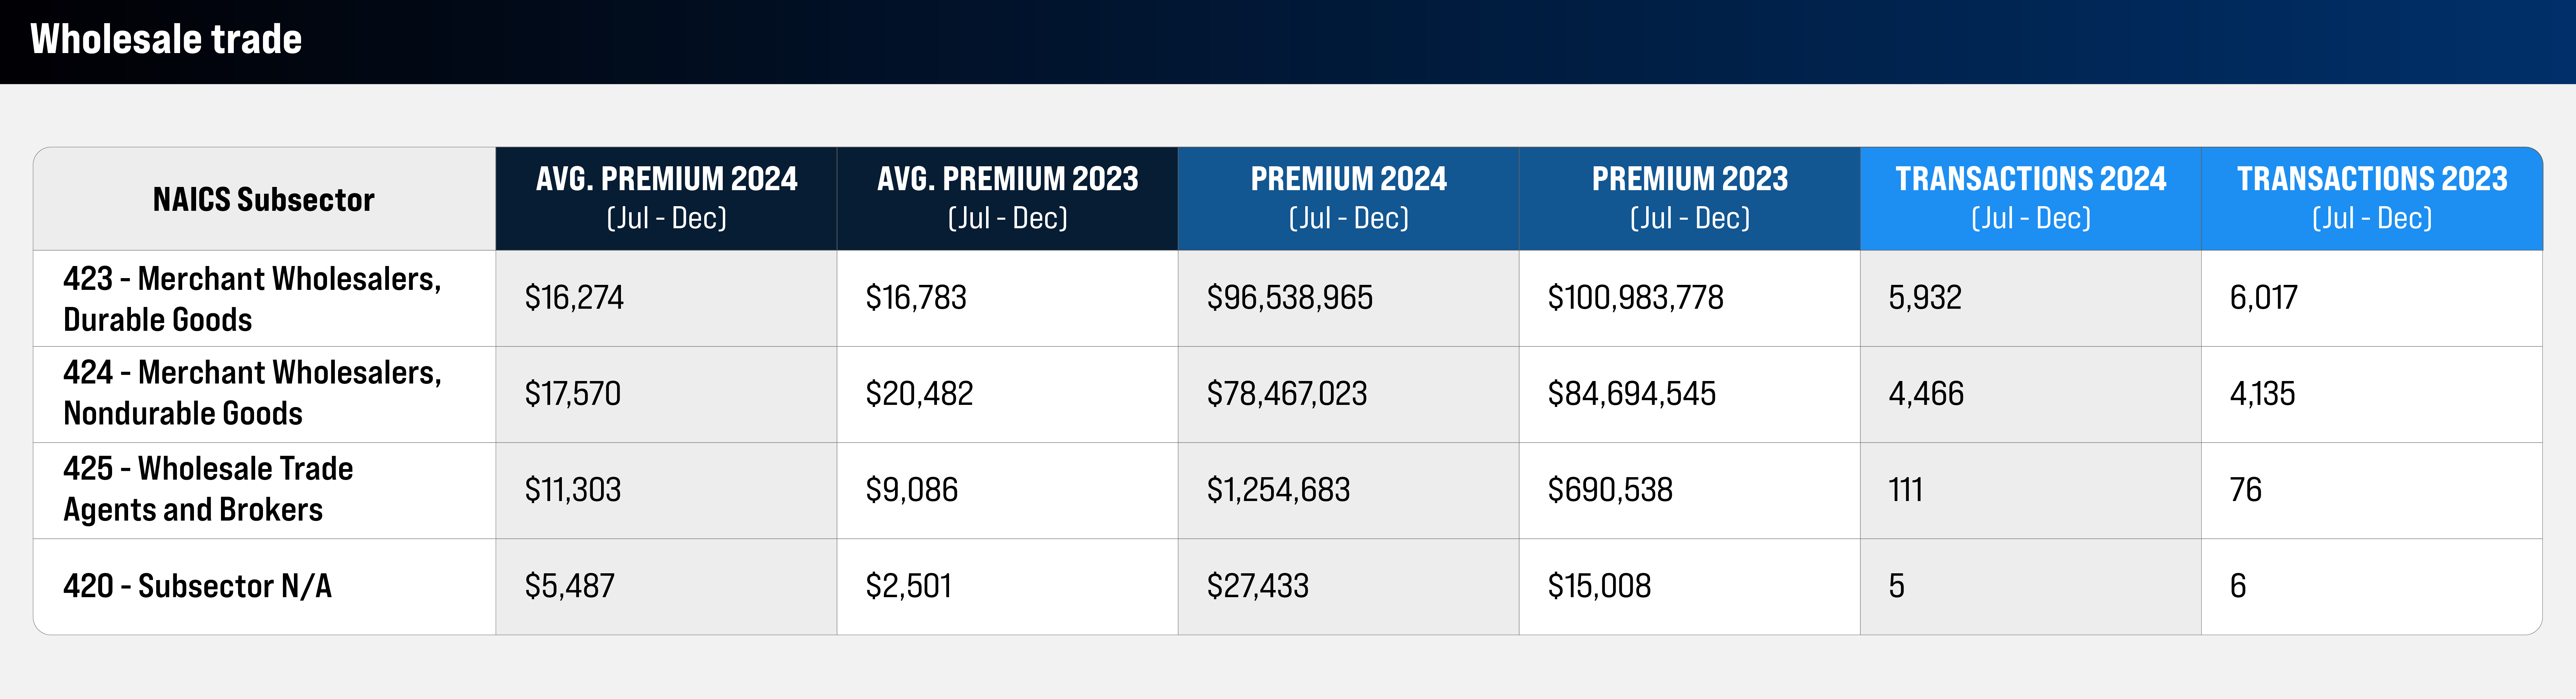
In the wholesale trade sector, wholesale trade agents and brokers saw a significant premium increase of 81.7%, while merchant wholesalers of durable goods and non-durable goods saw minimal decreases in premiums.
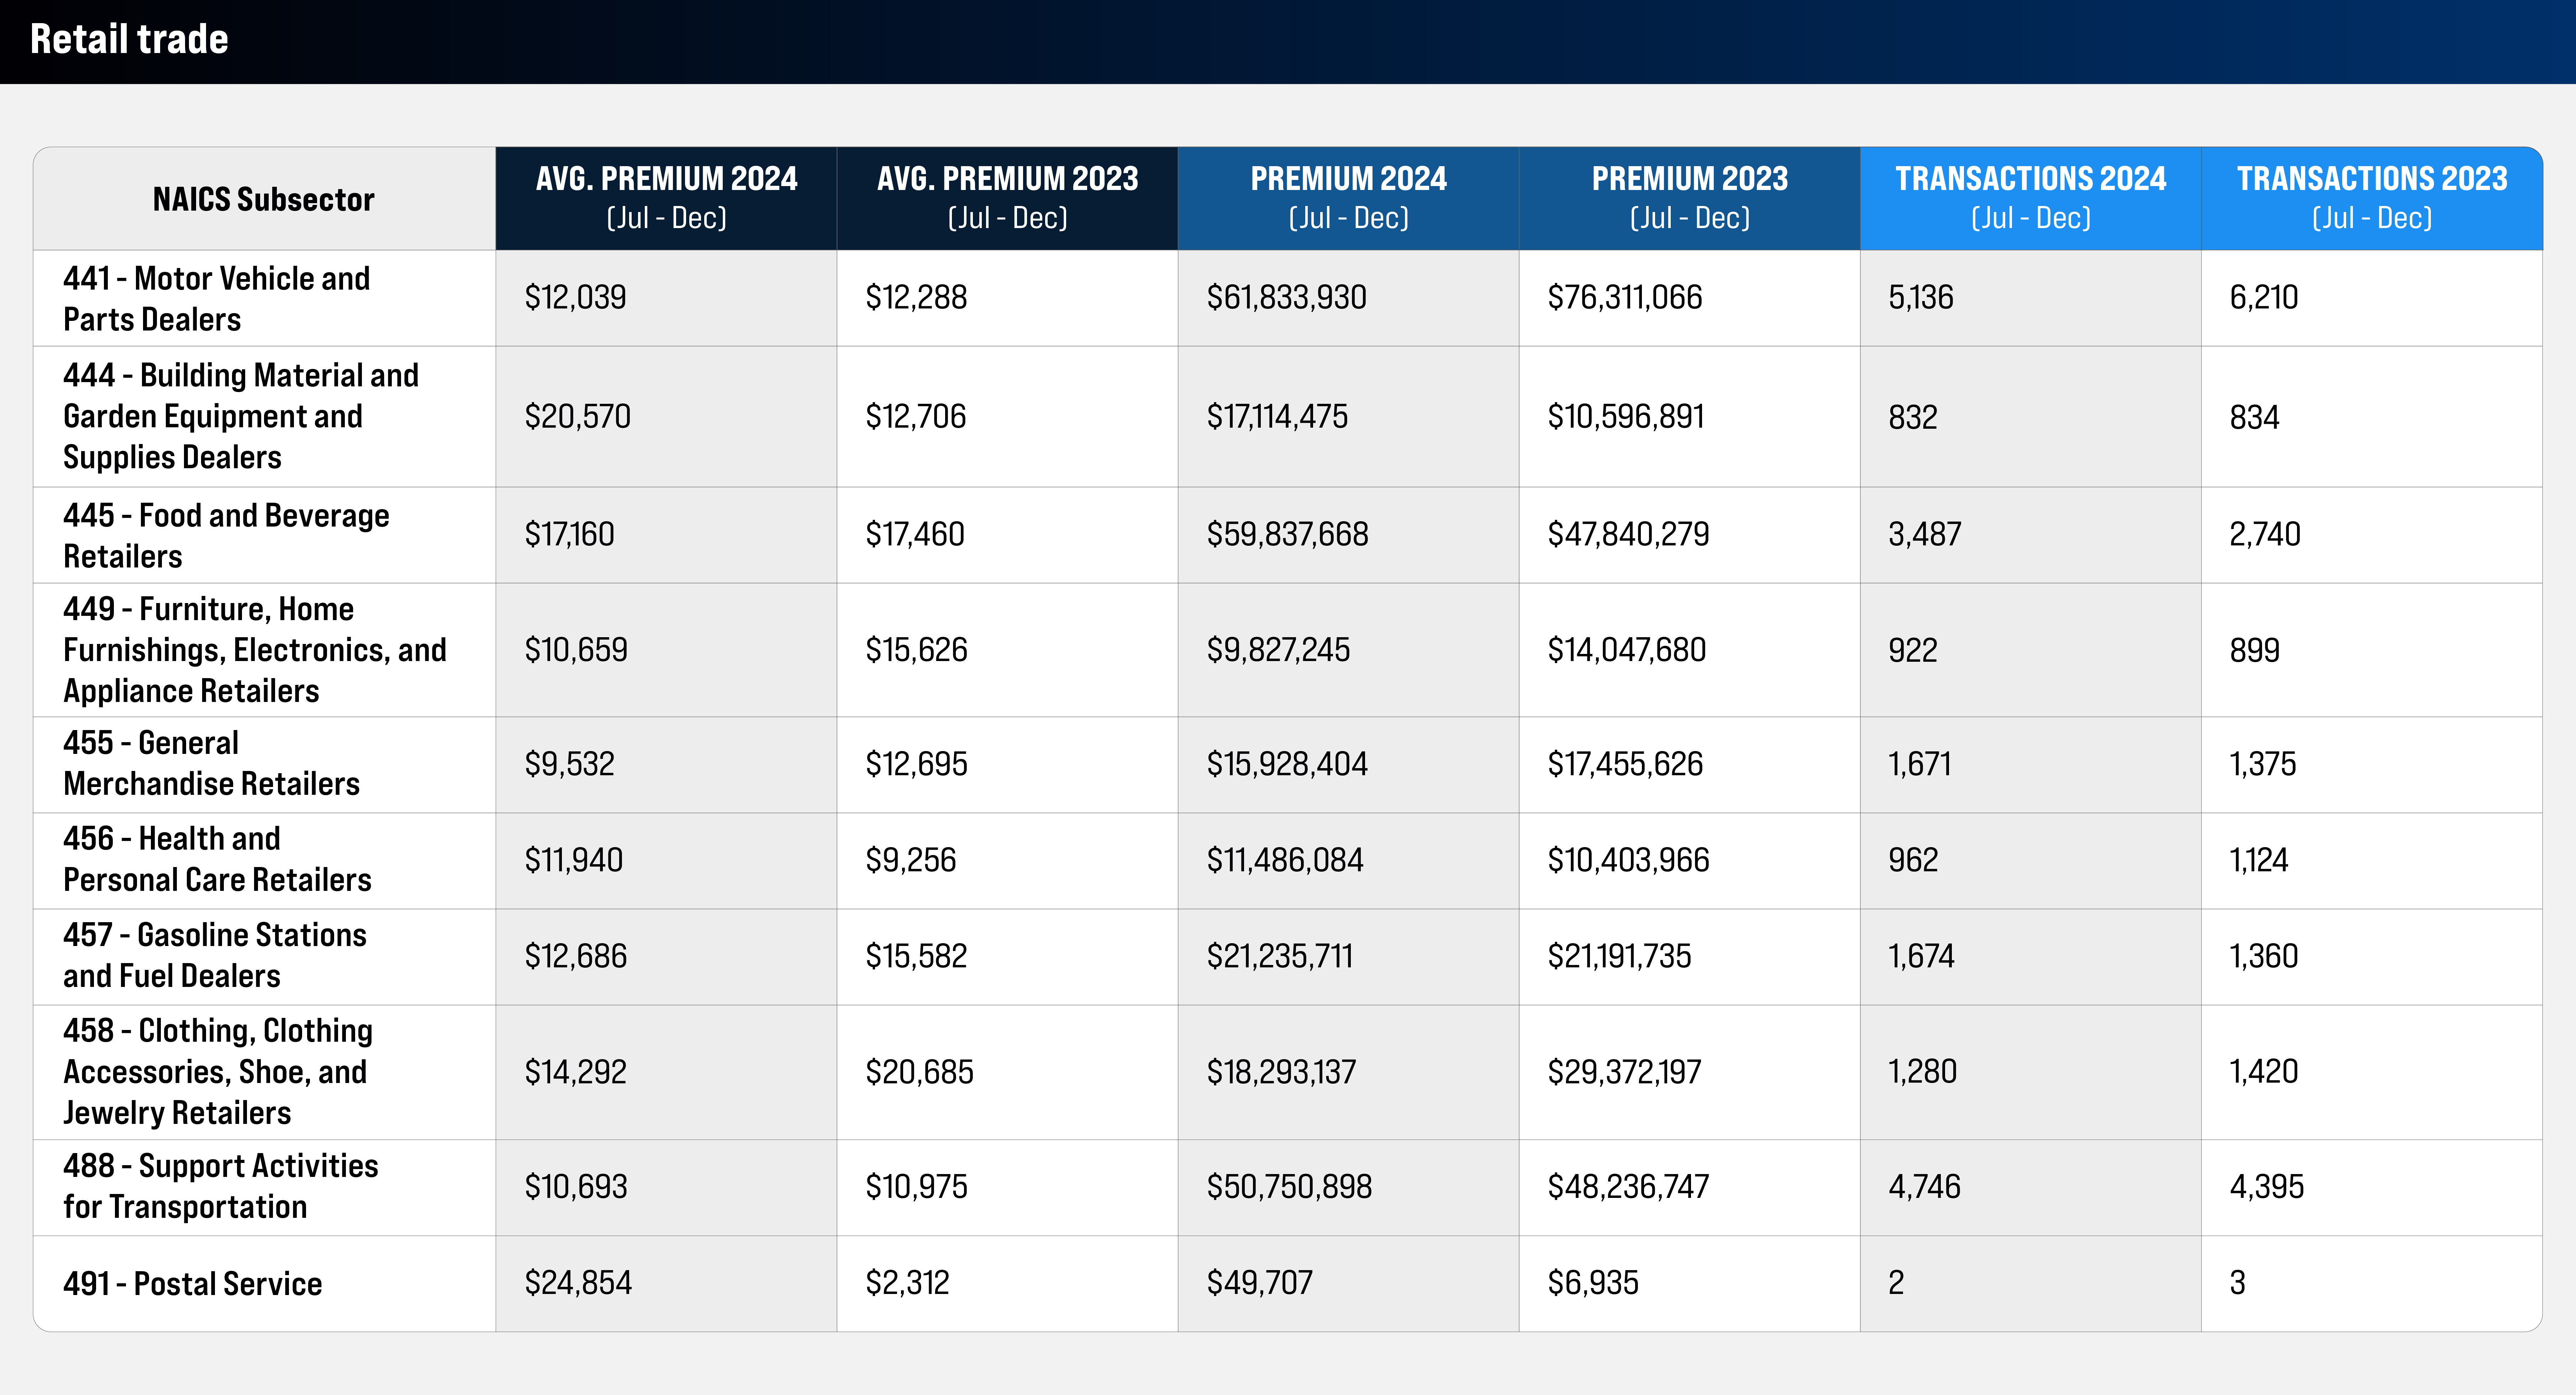
Motor vehicle and parts dealers experienced a 19% decline in total premium, accompanied by a 17.3% decline in transactions. Similarly, clothing, clothing accessories, shoe and jewelry retailers saw a 37.7% decrease in total premium.
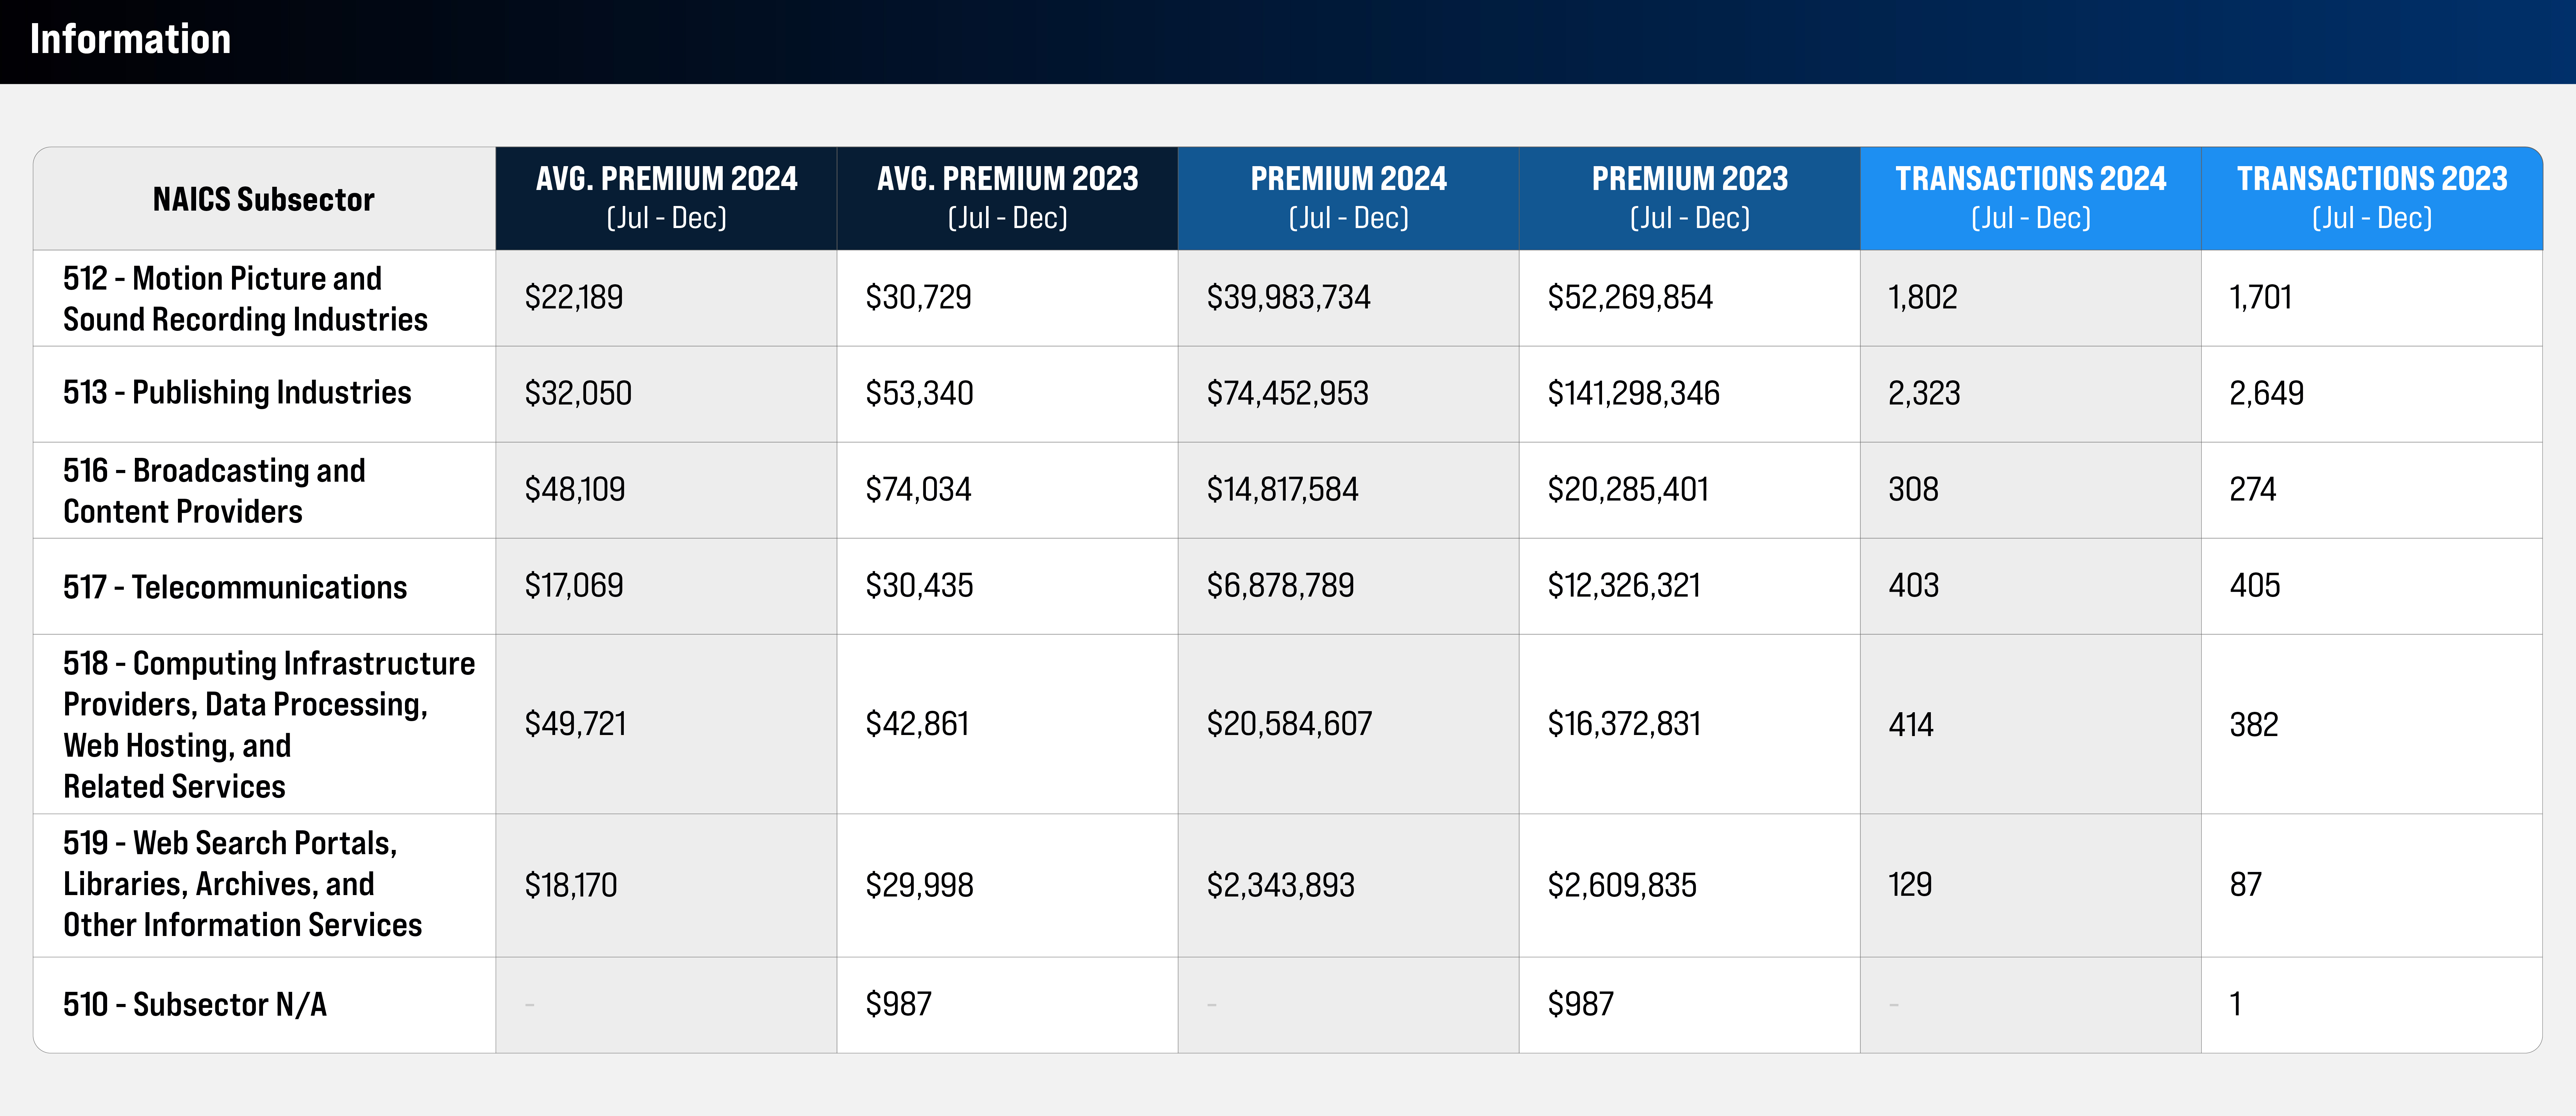
The information sector saw notable declines across nearly all subsectors, with the exception of computing infrastructure providers, data processing, web hosting and related services. The publishing industries subsector suffered the largest premium drop, with a decline of 47.3%.
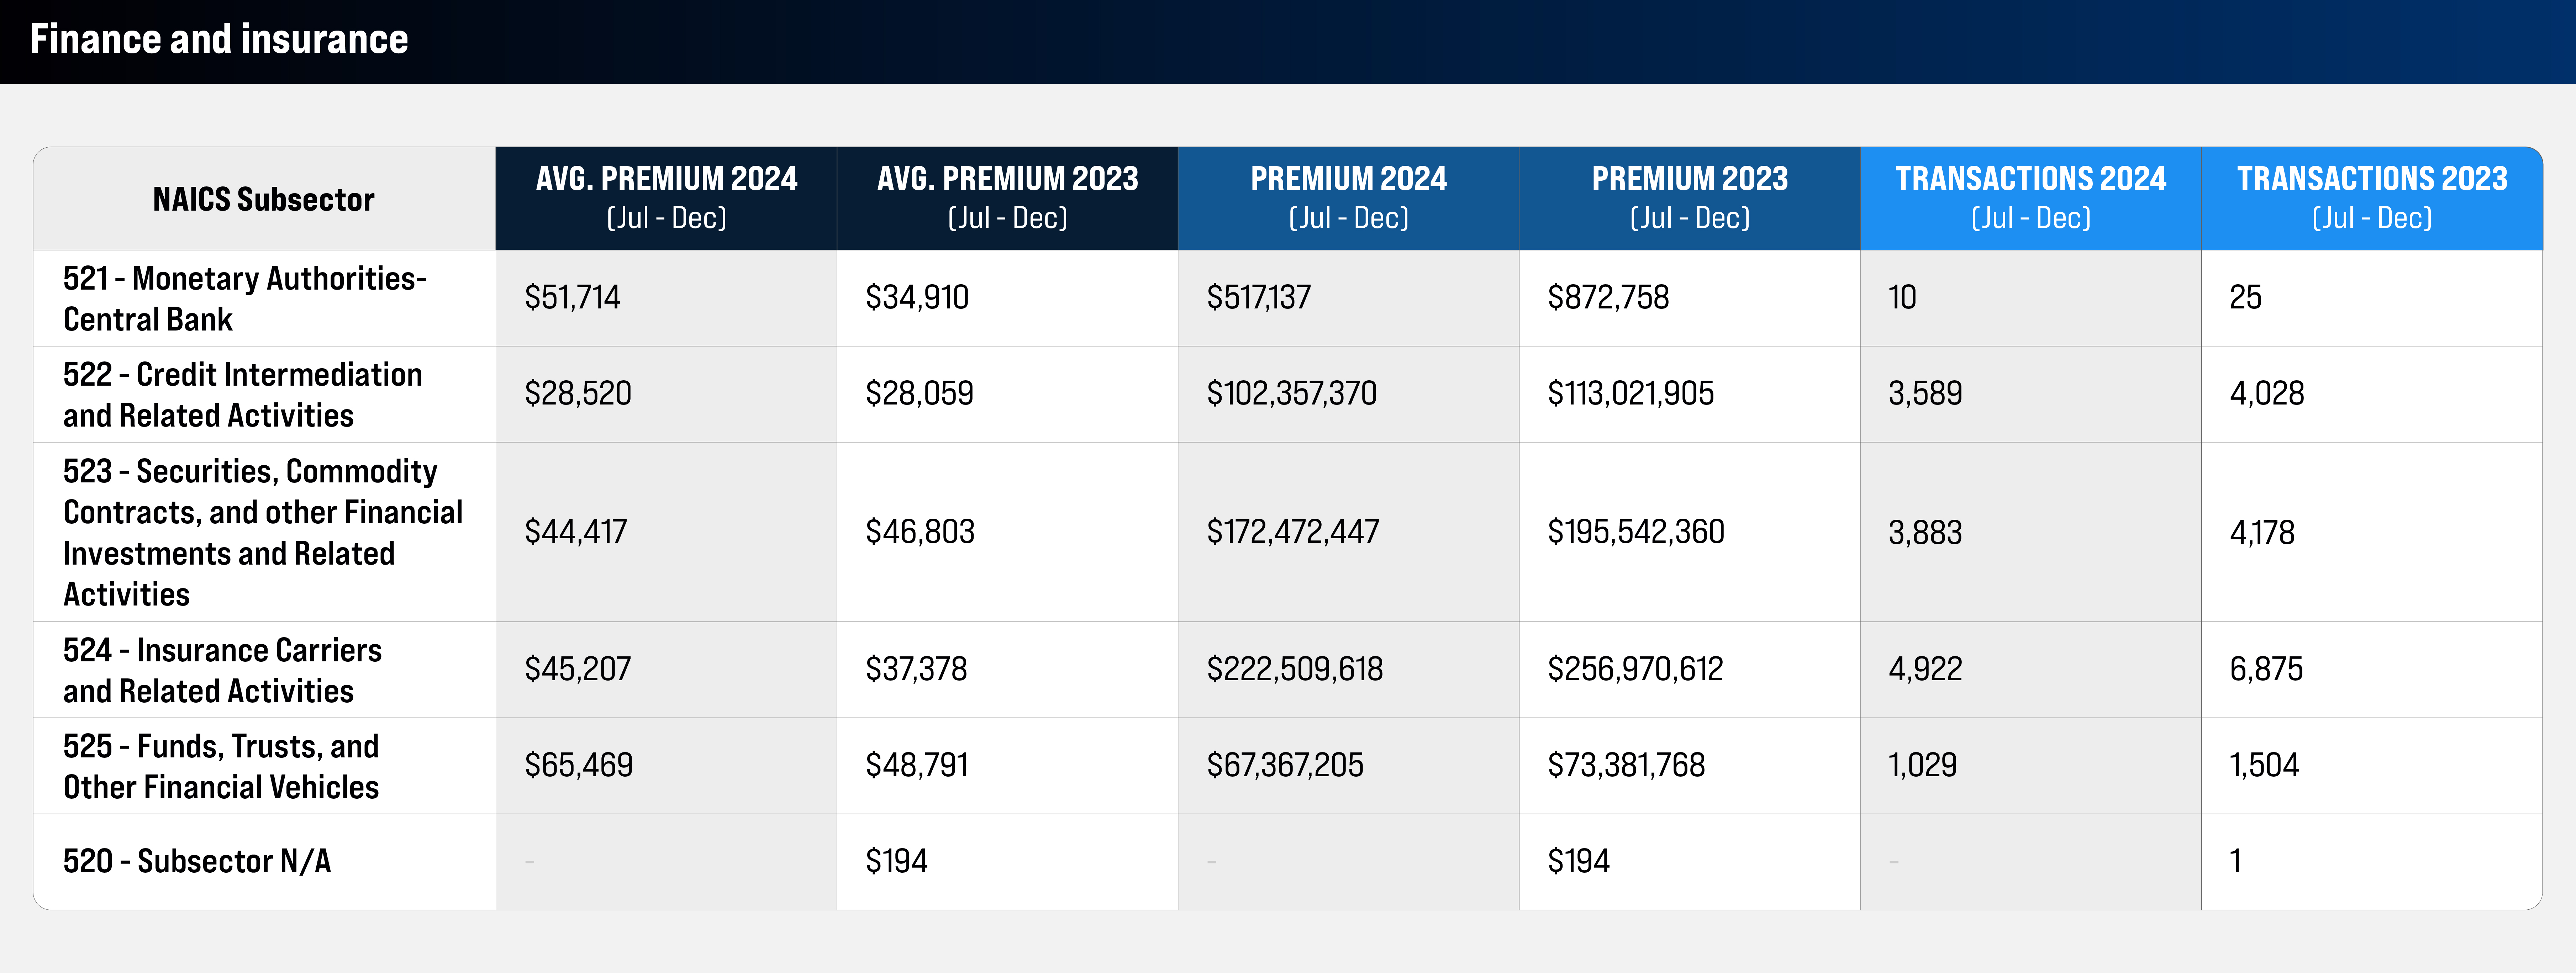
The finance and insurance subsectors experienced premium declines across the board, with the most significant drop coming from the monetary authorities-central bank subsector, which saw a 40.7% decline.
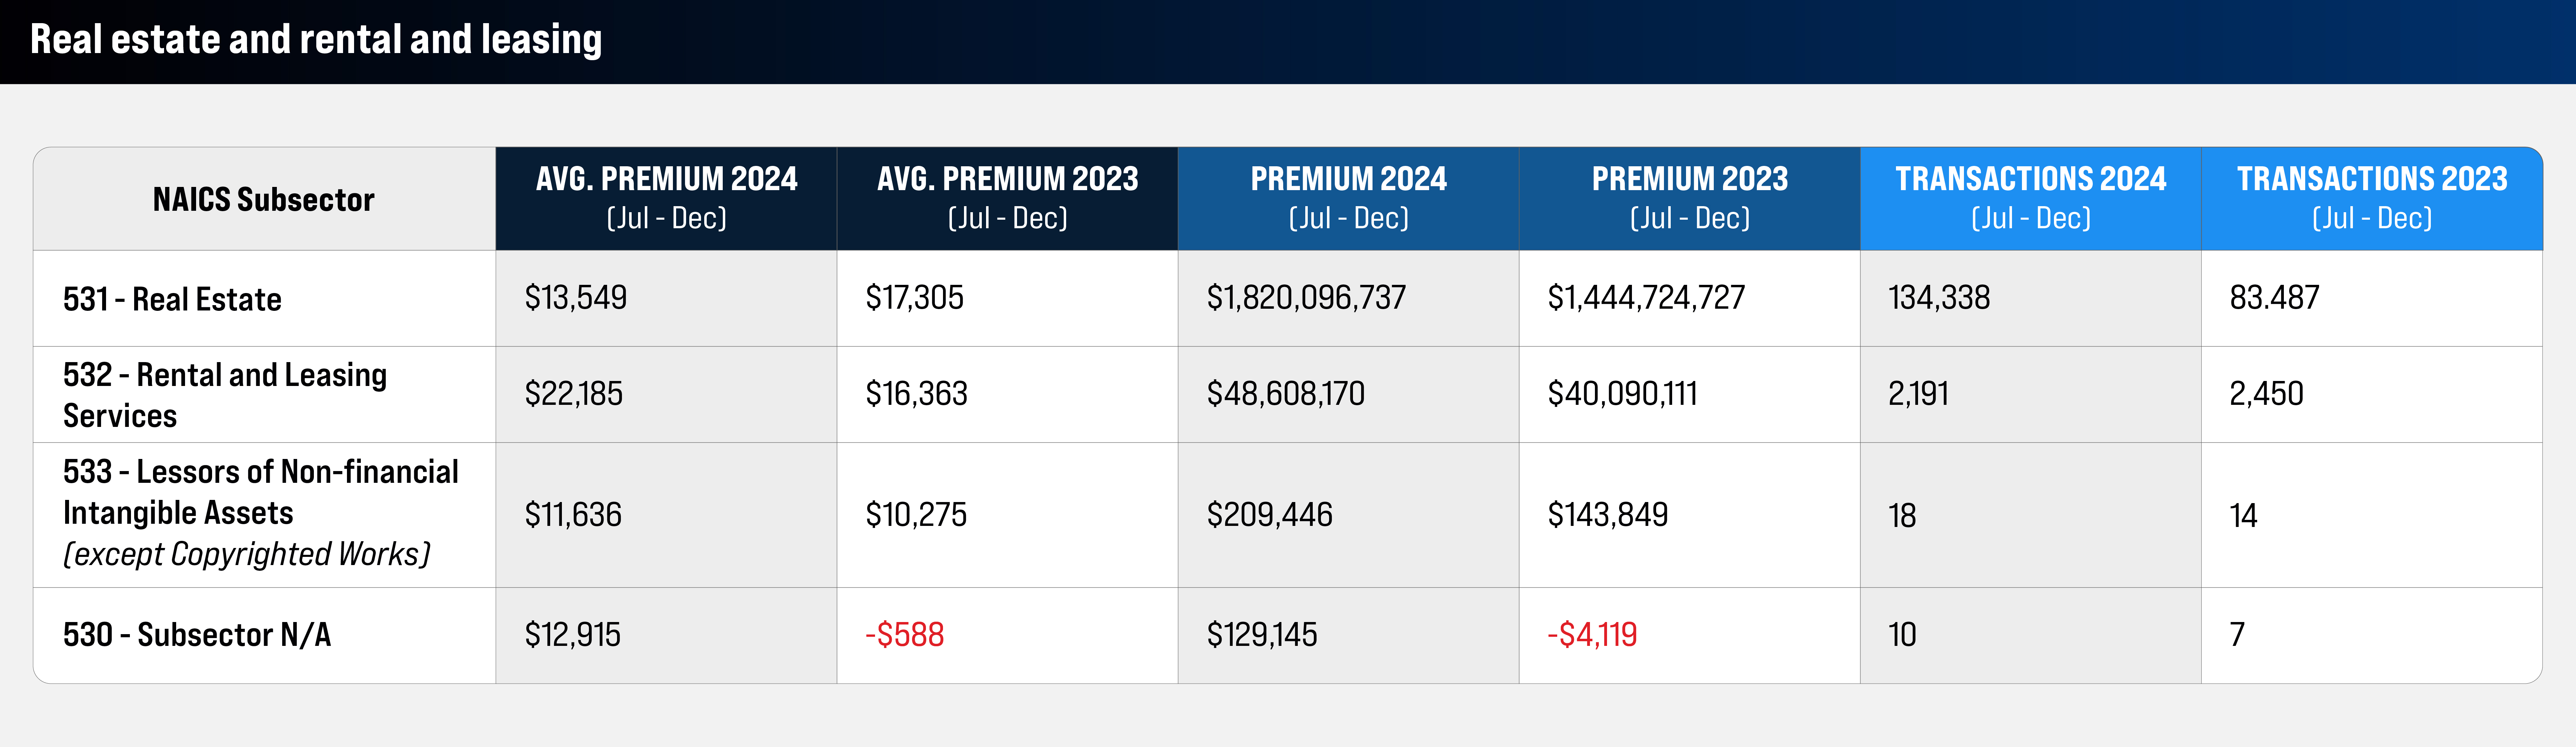
The real estate sector saw total premium increases across all subsectors, along with a rise in transactions, except in rental and leasing services. Notably, the real estate subsector saw a 26% increase in total premium.
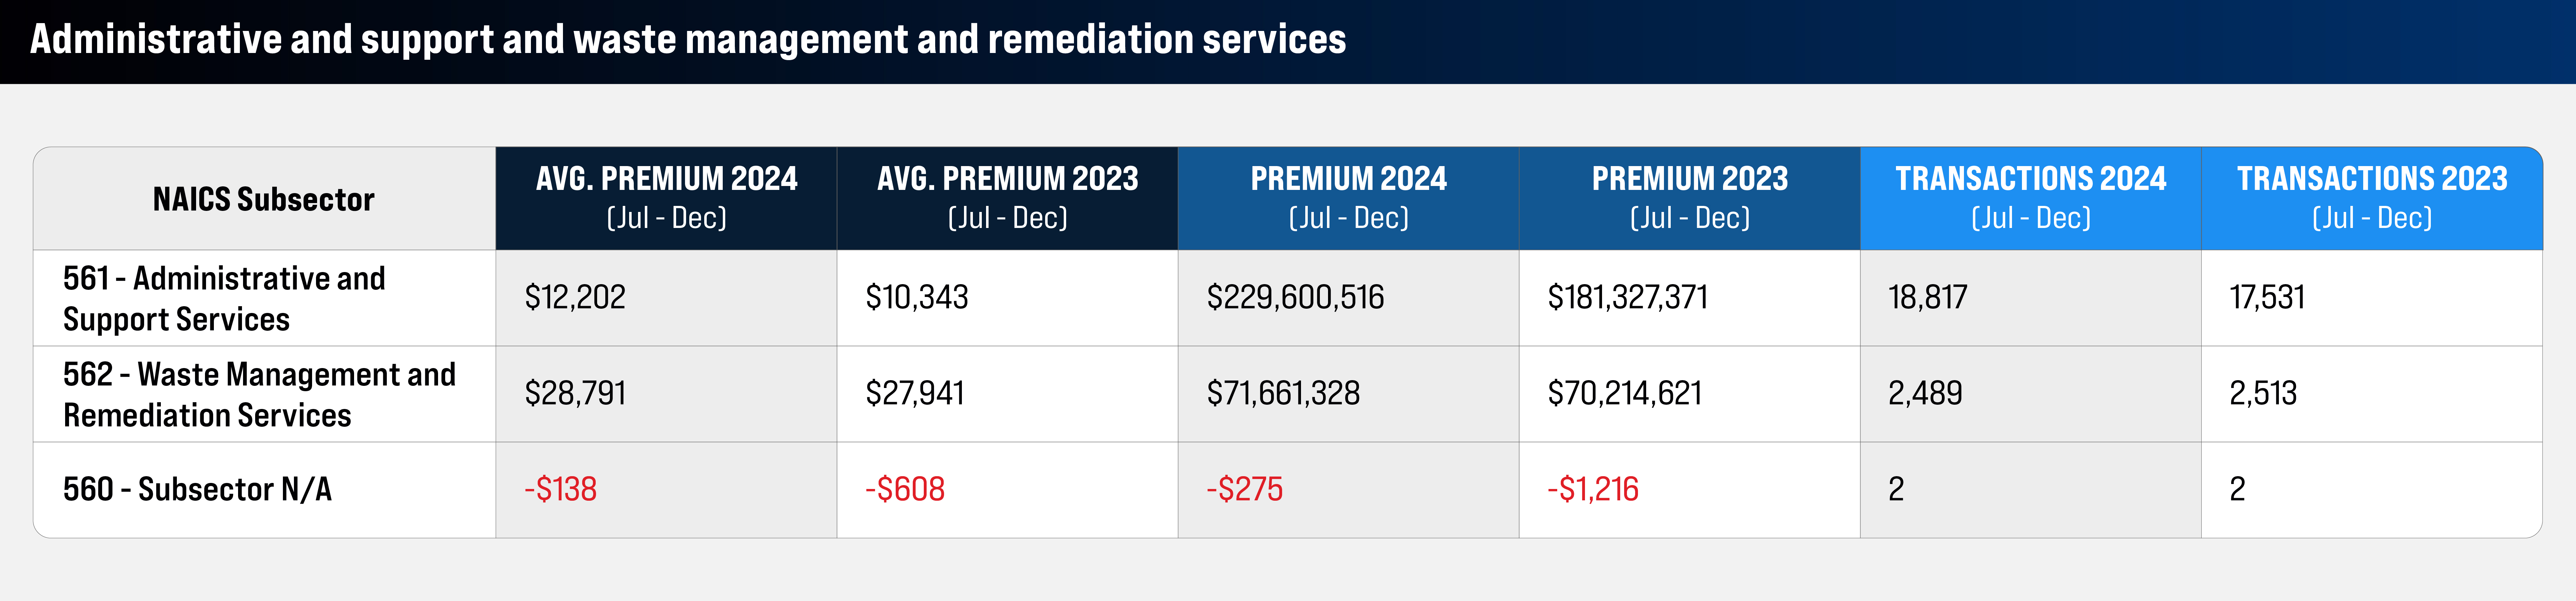
The administrative support and waste management and remediation services sector experienced increases in both total premiums and transactions across all subsectors. Administrative and support services saw the largest premium increase at 26.6%.
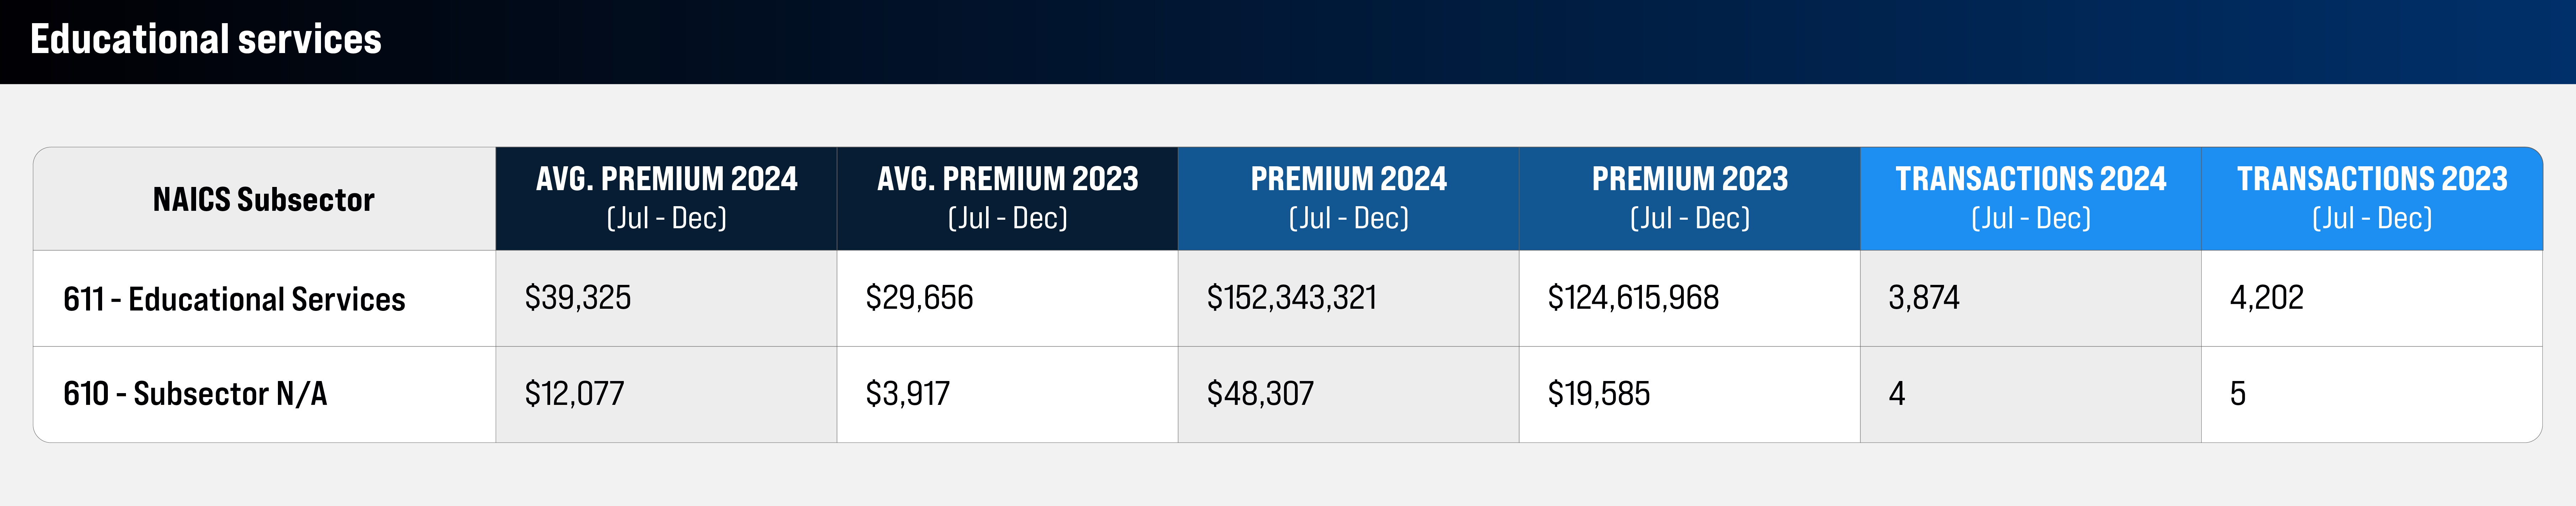
Educational services saw a 22.3% increase in total premium despite a 7.8% decline in transactions.
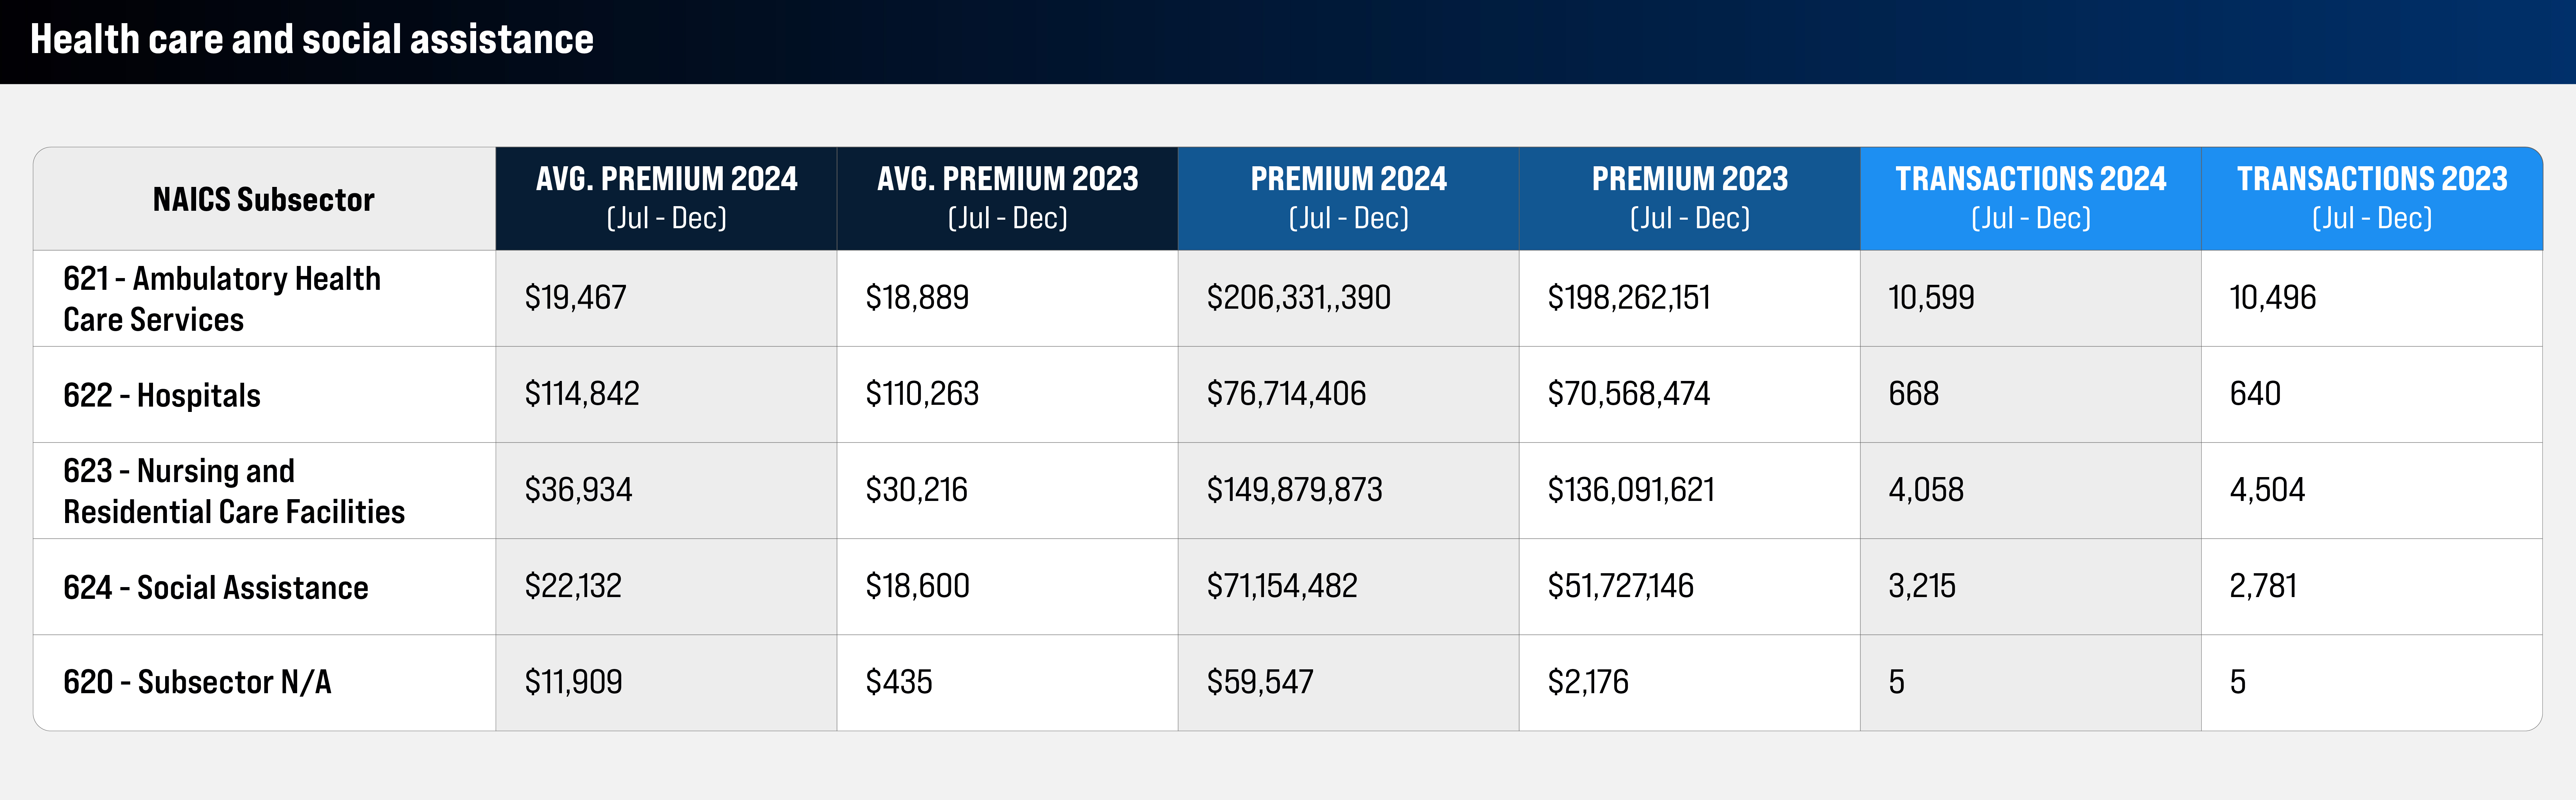
All subsectors within health care and social assistance saw an increase in total premium, with the social assistance subsector leading with a 37.6% increase.
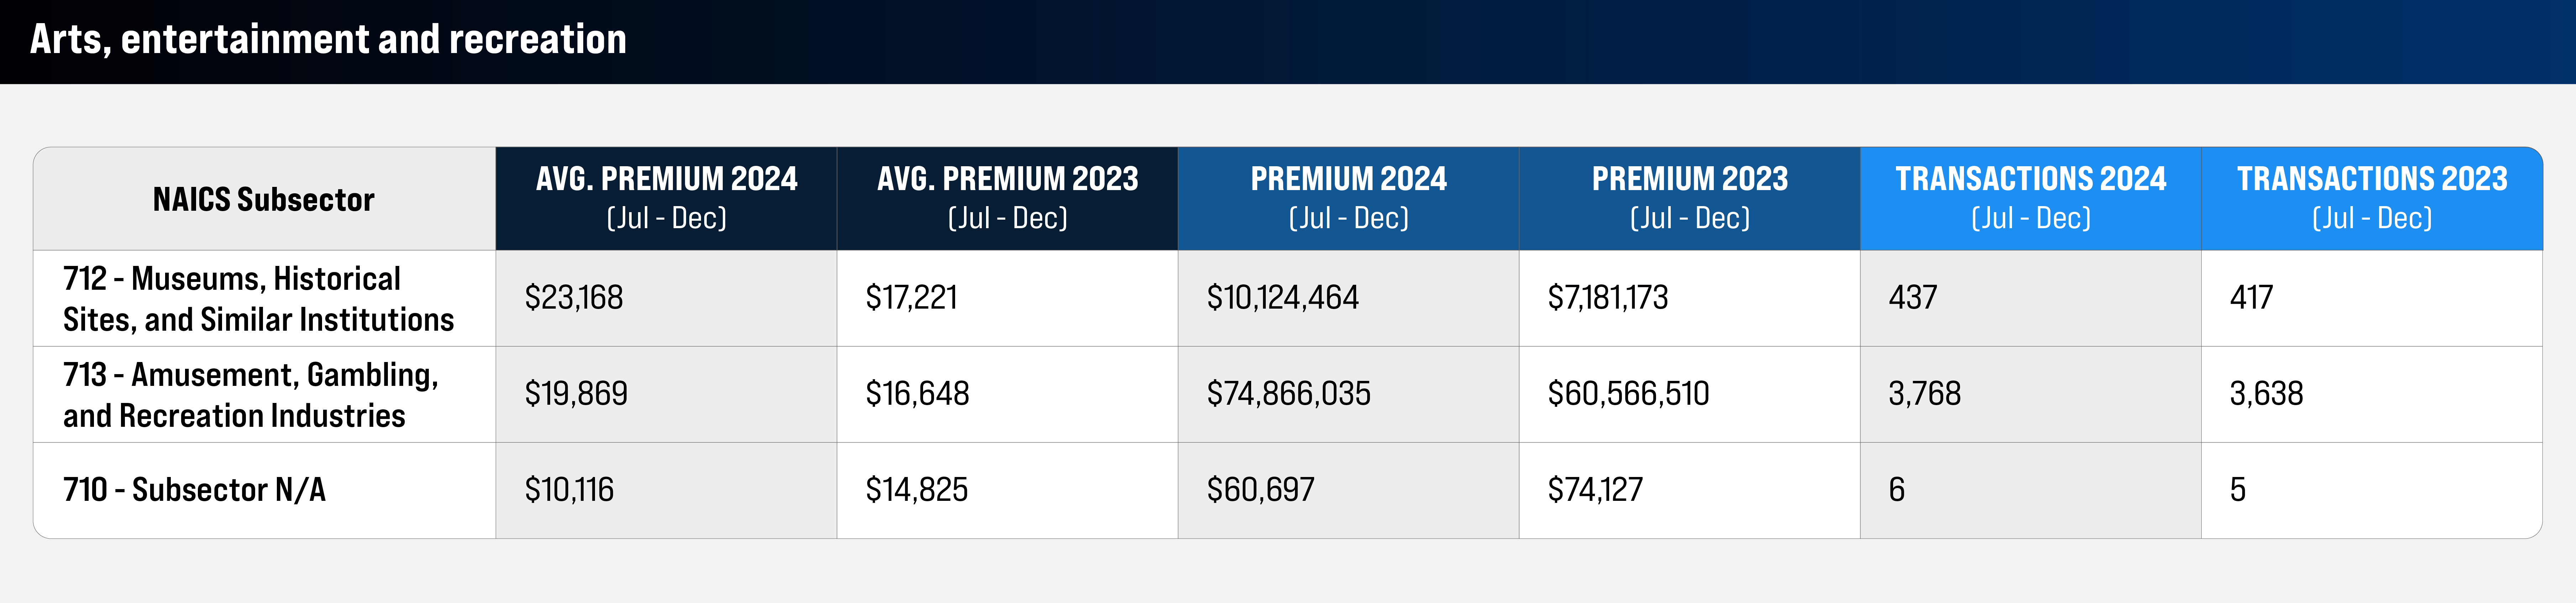
The arts, entertainment and recreation sector experienced increases in both total premium and transactions. The most notable growth was seen in museums, historical sites and similar institutions, which saw a 41% increase in premium.
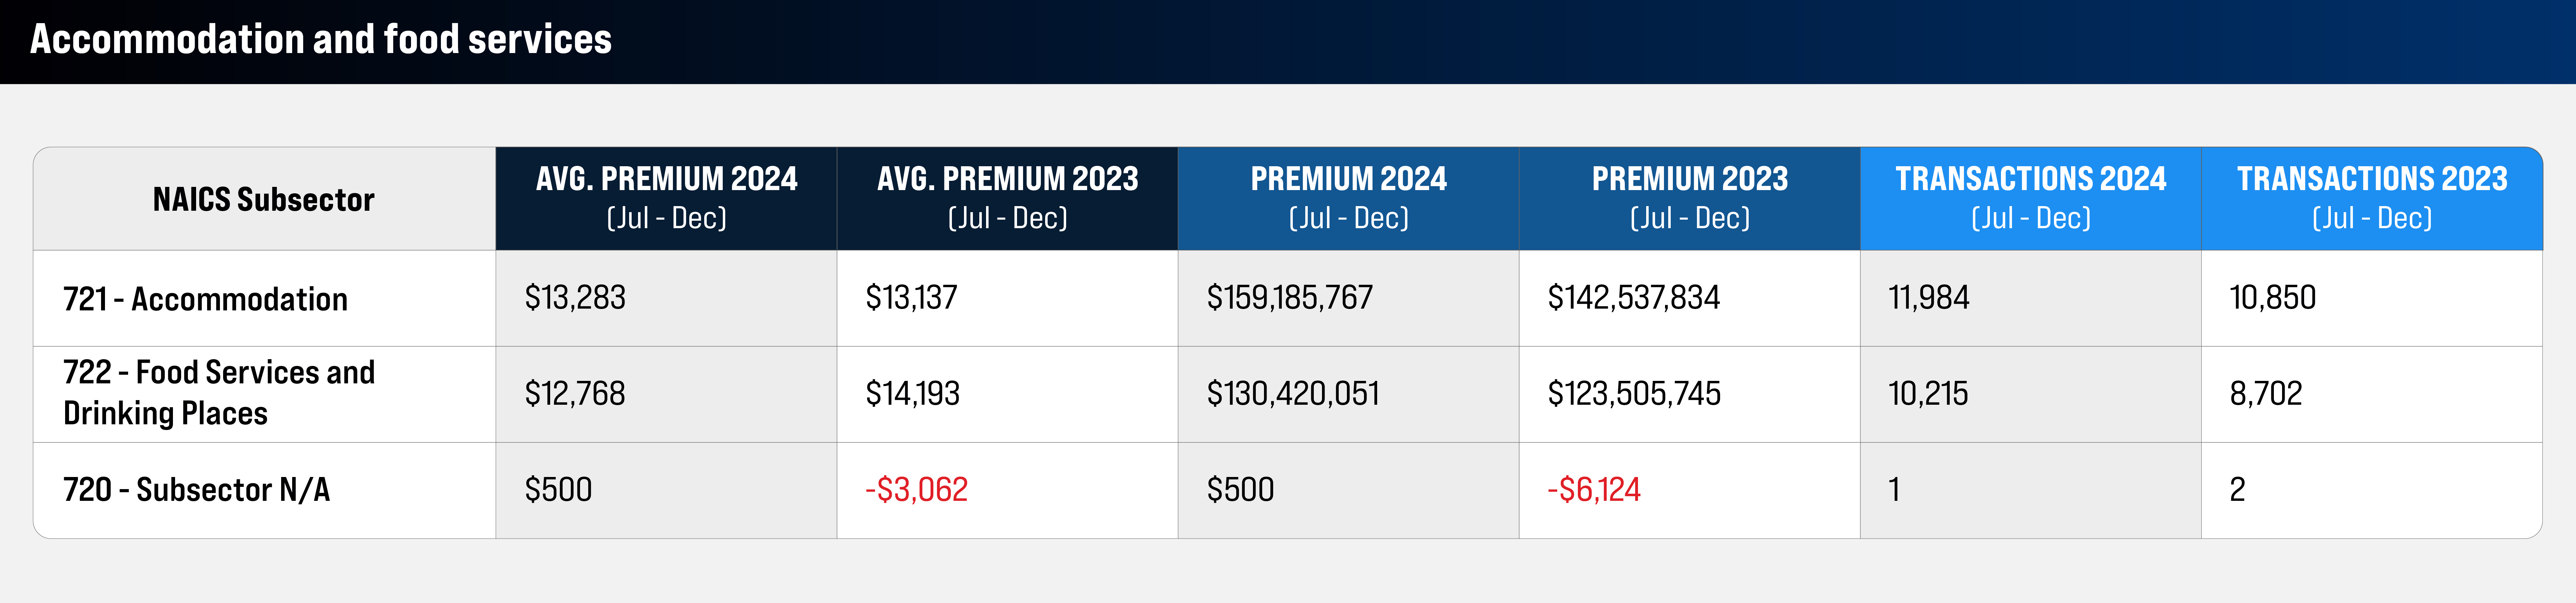
Total premium and transactions rose within the accommodation and food services sector. Accommodation saw a 11.7% increase, while food services and drinking places grew by 5.6%.
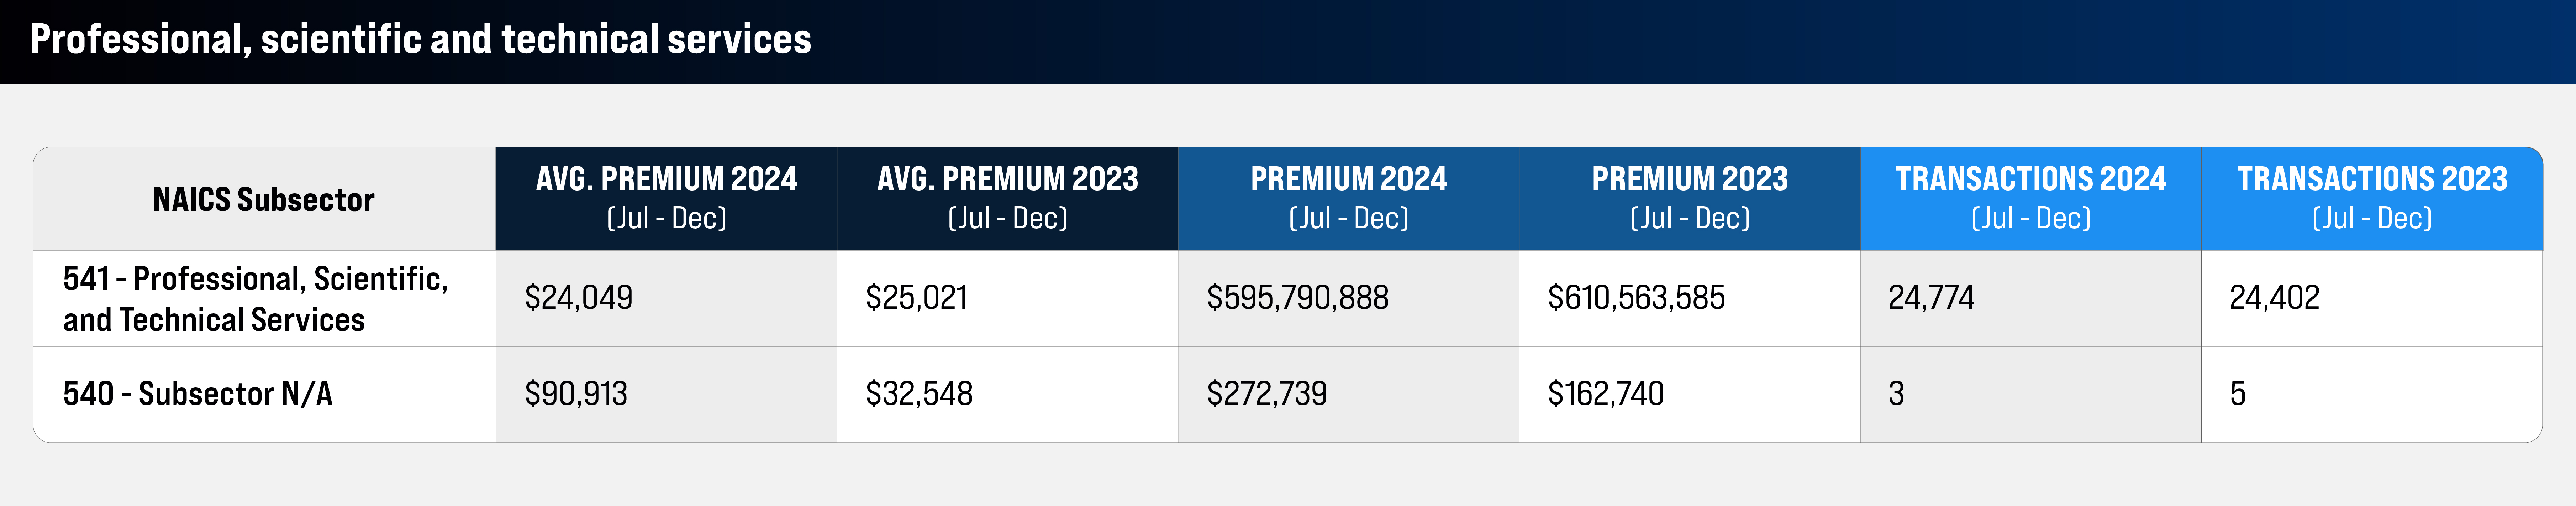
The professional, scientific and technical services sector saw a 2.4% decline in total premium.
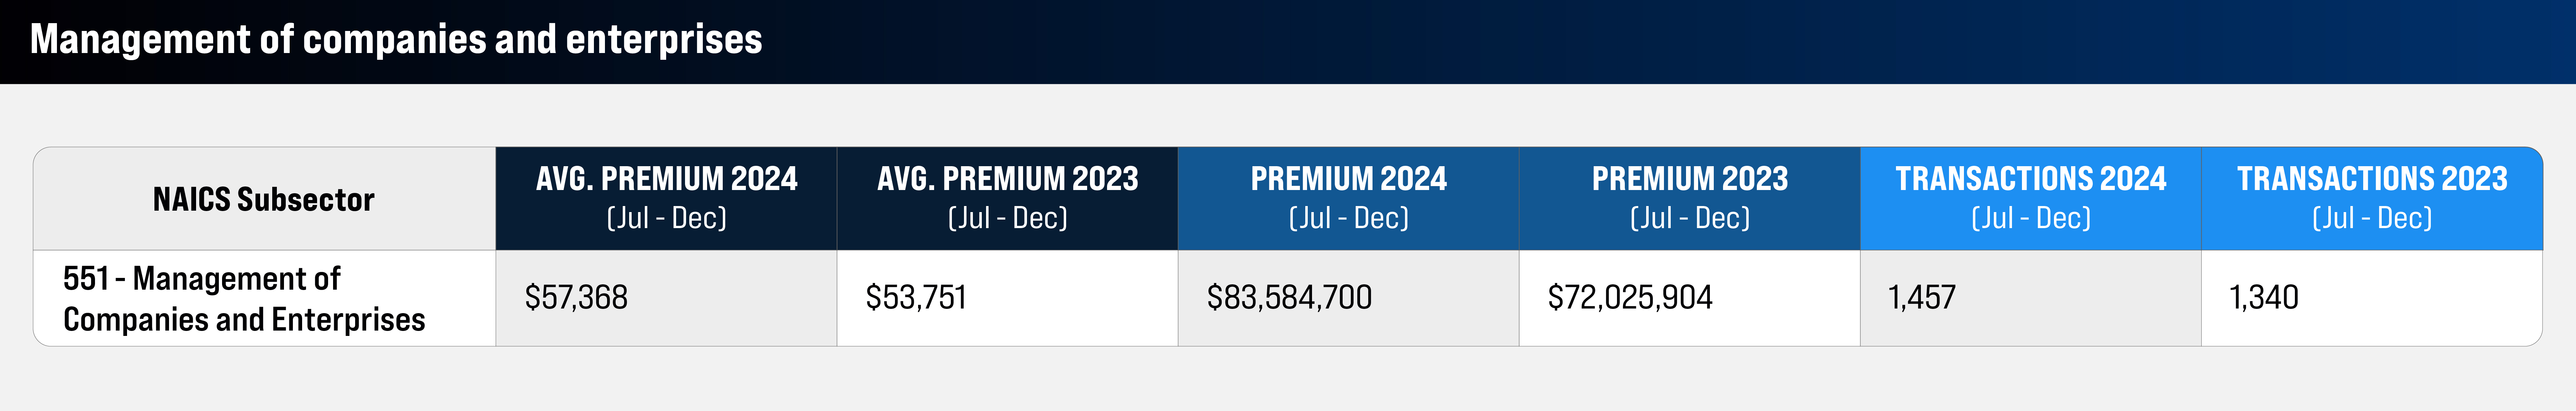
Total premium for management of companies and enterprises increased by 16%, alongside an 8.7% increase in transactions.
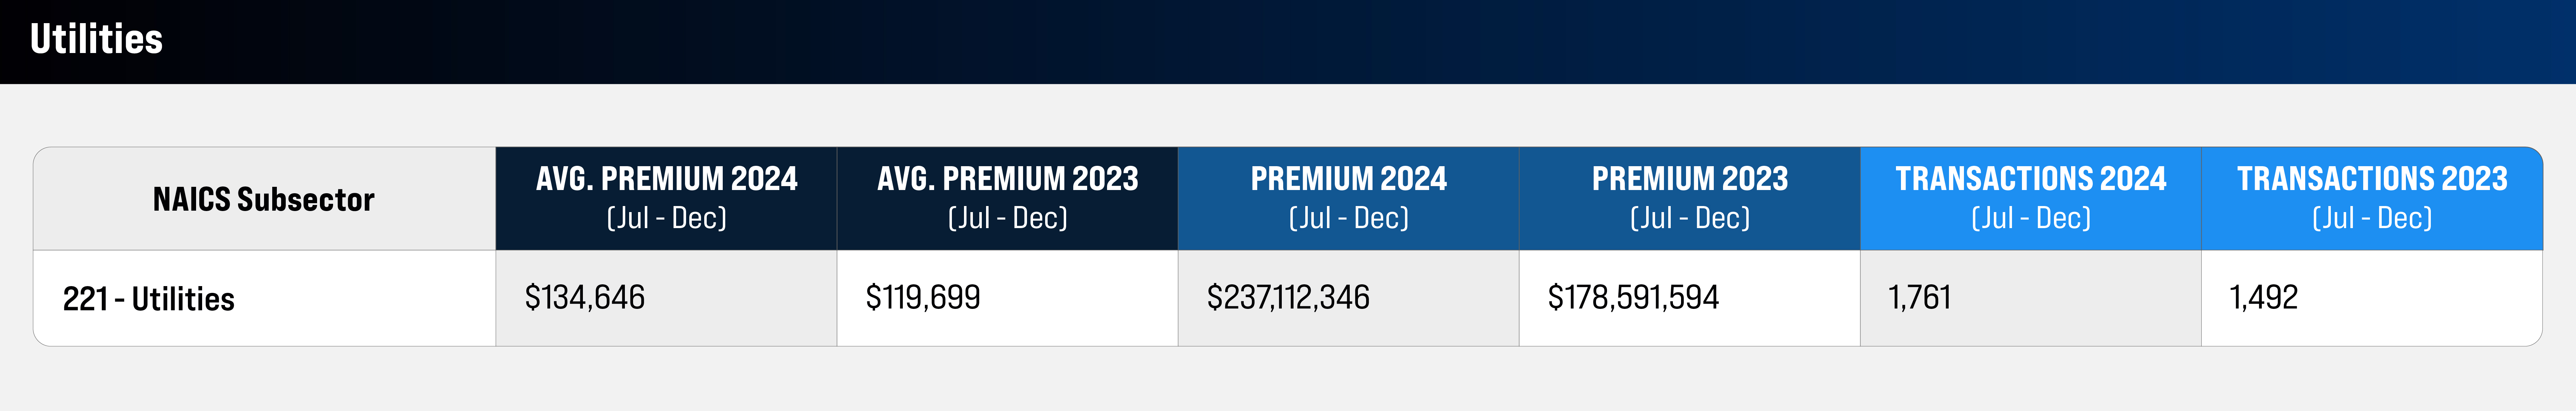
Utilities saw increases in both total premium and transactions, with premiums rising by 32.8%.
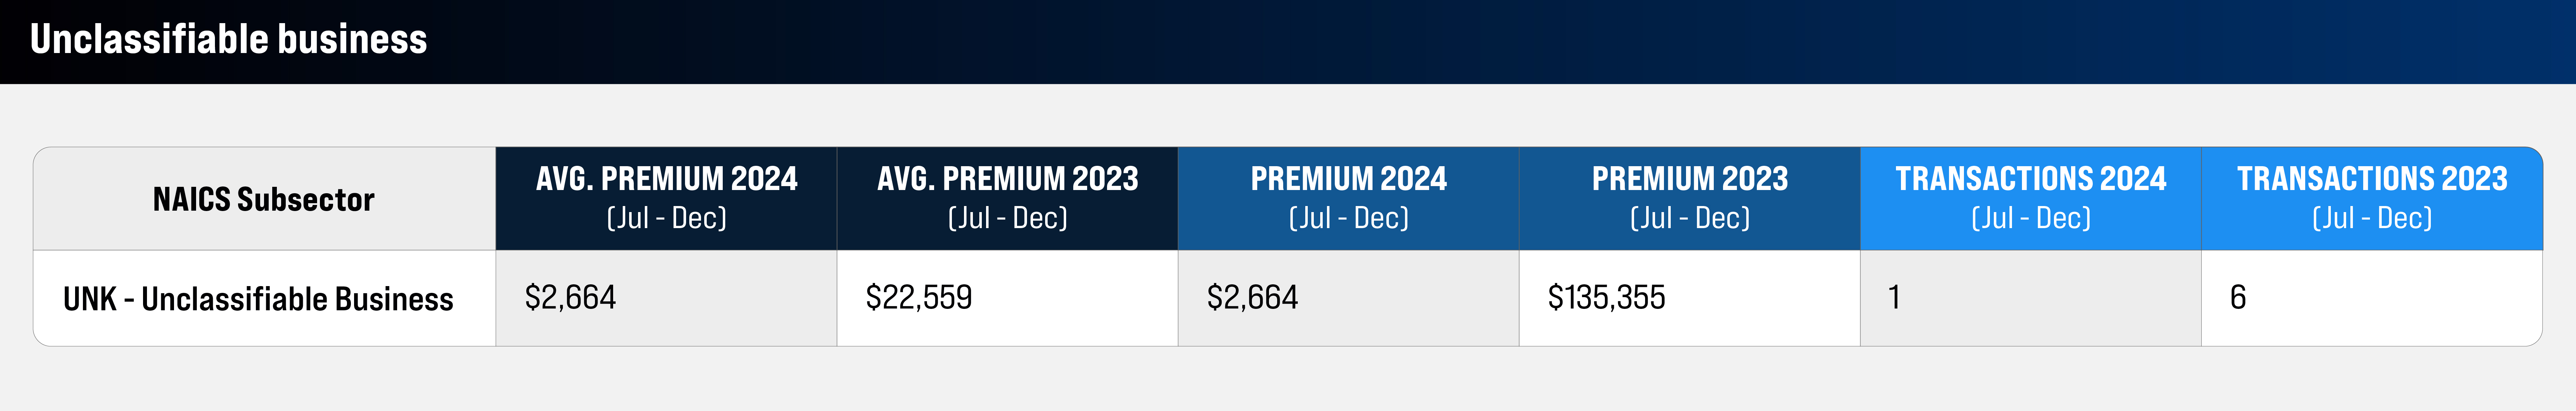
The unclassifiable business sector experienced a 98% decline, with only one transaction accounting for the total premium in 2024.