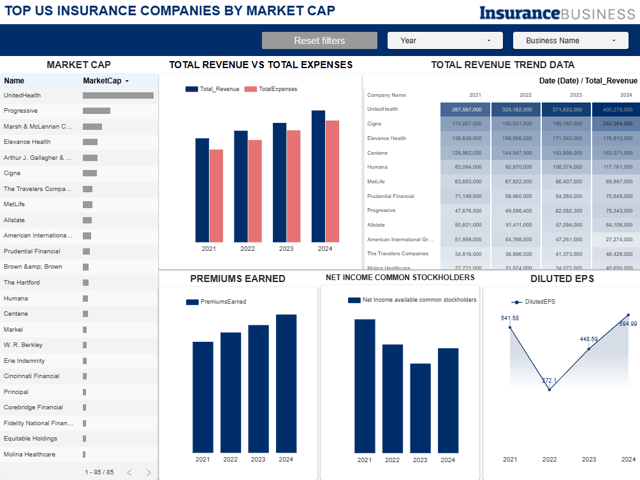
In Earnings Per Share, since 2021 The Hartford grew 7x and Allstate tripled. Centene more than doubled, with positive EPS growth unique among top health providers
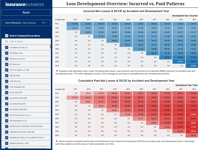
This dashboard offers a comprehensive and structured analysis of insurer reserve development patterns, paid losses, and reserve adequacy based on the Annual Statement Year 2024. It is designed to support informed decision-making across underwriting, product strategy, financial planning, claims management, and regulatory compliance
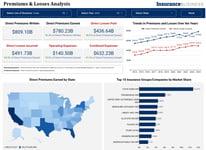
The Property and Casualty Financial Insights Dashboard provides a comprehensive view of financial performance across business lines. Users can analyze key metrics, including premium written, premium earned, losses, expenses, market share and financial ratios. Interactive filters by line of business (LOB), year and state allow for trend analysis, market comparisons and pattern identification

The Property and Casualty LOB Performance and Market Trends Dashboard provides a comprehensive comparison of LOB categories and subcategories, enabling users to analyze key financial ratios, market share, premium trends, losses, and defense expense structures. With filtering options and a dedicated subcategory analysis page, this dashboard supports data-driven decision-making for industry professionals seeking insights into market dynamics
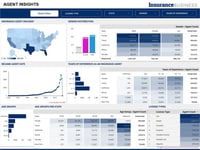
This dashboard offers detailed insights into insurance agent distribution by state, gender, age, experience, and license type. It helps carriers and brokerages with territory planning, competitor analysis, recruitment strategy, and forecasting licensing needs

In Earnings Per Share, since 2021 The Hartford grew 7x and Allstate tripled. Centene more than doubled, with positive EPS growth unique among top health providers

In a business environment defined by economic volatility, rising regulatory pressure, and post-pandemic recalibration, analysts say that few firms in the insurance sector exhibit the kind of steadiness that characterizes Marsh LLC

Behind premium gains lie slowing exposures, inflation-driven pricing, and a volatile road ahead for the US auto insurance market. Amid this, five major insurers chart sharply different courses towards growth, profit, and resilience.

Liability insurance defense costs are significantly higher in states like New York, California, and Washington, but while this spending has begun to decrease nationwide, rising social inflation is driving up losses and increasing pressure on insurers